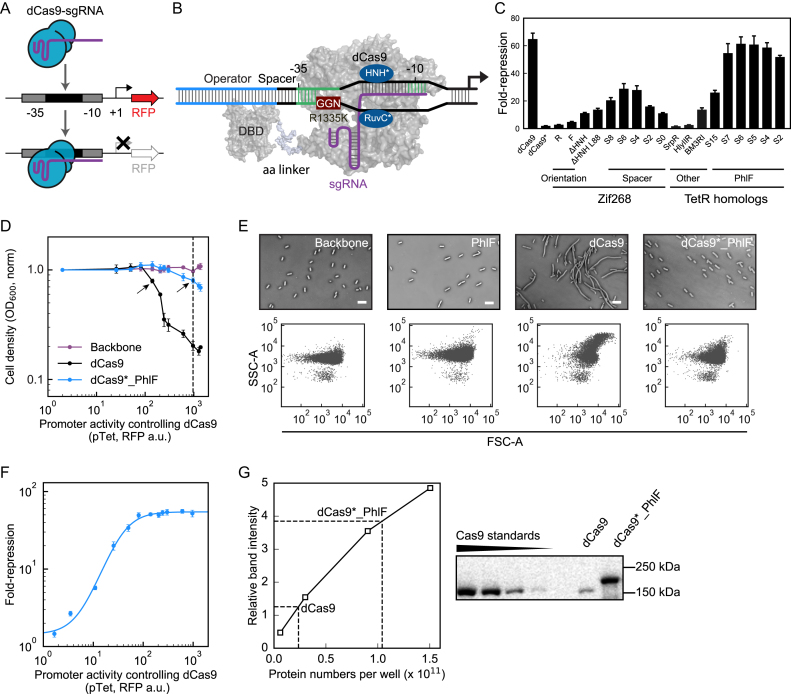
Figure 1.
Design and evaluation of a dCas9 – transcription factor fusion. (A) A schematic of targeted repression by dCas9-sgRNA complex bound to the promoter region of a fluorescent reporter gene (RFP, red fluorescent protein). (B) A detailed schematic of the fused protein bound to a promoter is shown. DBD is the DNA-binding domain that is fused to dCas9. GGN is the PAM site. R1335K is the mutation that reduces the PAM recognition ability of dCas9. (C) The impact of changes to the fused protein and promoter on the response. The fold-repression is calculated as the ratio of uninduced to induced (1 mM IPTG) cells (Methods). All constructs other than the first are based on dCas9* (R1335K). F and R represent the forward and reverse orientations of the Zif268 operator. ΔHNH refers to the deletion of this domain. L88 shows the impact of a longer linker. The size of the spacer between the -35 and operator sequence is shown as SN, where N is the number of bp. Sequences and plasmid maps are shown in Supplementary Figure S12 and Supplementary Table S2. SrpR, HlyIIR and BM3RI are all TetR-family repressors that were tested as alternatives to PhlF. (D) The growth impact of dCas9 and dCas9*_PhlF is compared to the pSZ_Backbone plasmid (Supplementary Figure S12) as a control. Protein expression is controlled using the aTc-inducible system and the x-axis is shown in units of fluorescence for the pTet promoter, measured separately (Supplementary Figure S1). The dashed line shows 2.5 ng/ml aTc, used in E for morphology studies. The arrows point to the inducer levels (0.7 ng/ml and 2.5 ng/ml) where the protein concentrations are determined in Figure 1G. Media and growth conditions are provided in the Materials and Methods. (E) Microscopic images of E. coli strains expressing PhlF, dCas9 or dCas9*_PhlF variants and a control (Backbone) are shown, under identical conditions as used for the growth curves. The scale bars are 5 μm. The corresponding FSC-A/SSC-A distribution of each strain was measured by flow cytometry (Materials and Methods). (F) The fold-repression of the construct (pSZ_PhlF plasmid in Supplementary Figure S12 and the pPhlF_S6 promoter from Supplementary Table S2) is shown as a function of dCas9*_PhlF expression. The sgRNA is under the control of the pTac promoter and all data are for 1 mM IPTG. The x-axis is the same as described in D. The line shows a fit to a Hill equation. For B–F, the data are shown as the mean of three experiments performed on different days and the error bars are the standard deviation. (G) A representative immunoblotting assay is shown for calculating the number of dCas9 per cell. The dashed lines show the interpolation used to estimate concentrations. The calculation is described in the Methods and the numbers presented in the text are based on three experiments performed on different days (Supplementary Figure S3).

