Figure 3.
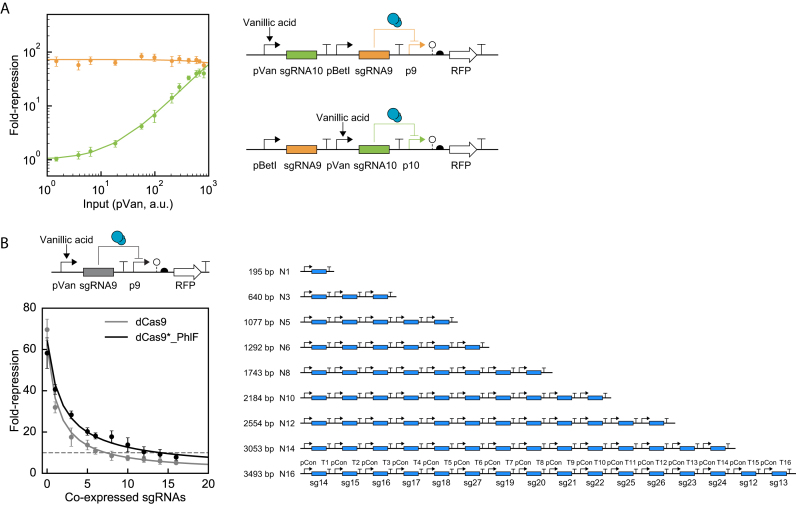
The impact of simultaneous expression of multiple sgRNAs. (A) Expression of sgRNA9 was fully induced (10 mM choline, activating pBetI) to measure fold-repression of promoter p9 (orange), while the expression level of sgRNA10 (green) was induced by adding different levels of vanillic acid. The activity of the pVan promoter was measured separately as a function of vanillic acid concentration (Supplementary Figure S1). The detailed parts used in the genetic systems are shown in Supplementary Figure S13. Solid lines are model prediction results. (B) The impact of expressing multiple sgRNAs simultaneously. The repression fold change of promoter p9 was measured with or without the addition 100 μM vanillic acid. The constructs containing different numbers of sgRNAs are shown to the right. The sequences corresponding to the promoters and terminators are provided in Supplementary Table S3. The sgRNAs are labeled sgN where N corresponds to the sequences in Supplementary Figure S11. The horizontal line marks 10-fold repression, roughly the minimum required for useful NOT gates. For dCas9*_PhlF, the fit parameters for Equations (11) and (12) are β = 3.0 × 10⁻¹¹ Ms−1, α1 = 7.6 × 10⁻¹² Ms−1, αx = 2.3 × 10⁻¹¹ Ms−1, K = 1.7 × 10⁻⁸ M, n = 0.9. For dCas9, the fit parameters are: β = 3.0 × 10⁻¹¹ Ms−1, α1 = 7.6 × 10⁻¹² Ms−1, αx = 2.3 × 10⁻¹¹ Ms−1, K = 2.9 × 10⁻⁹ M, n = 1.1, In both parts, the data are shown as the mean of three experiments performed on different days and the error bars are the standard deviation.

