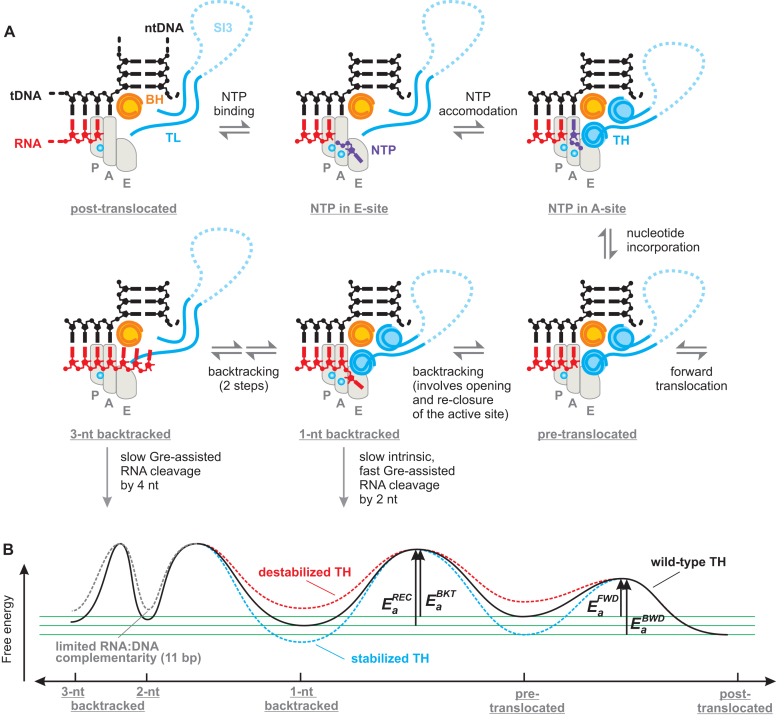
Figure 8.
Backtracking and NTP substrate loading into the active site may follow the same route. (A) Schematics of the RNAP active site; only BH, TL/TH and the nucleic acids near the active site are shown. The areas corresponding to P-, A- and E- sites are outlined by light grey shapes. Top row: the triphosphate moiety of the substrate NTP governs binding to the E-site followed by rotation into the A-site where the complementarity to the template DNA is probed (71). The cognate NTP stabilizes the closed active site that positions the triphosphate moiety for efficient catalysis (1). Bottom row: following nucleotide incorporation RNAP completes the cycle by translocating forward but may occasionally backtrack. Backtracking by 1 nt places the backtracked nucleotide into the E-site; the backtracked and the penultimate nucleotides stabilize the closed active site. Further backtracking inhibits the closure of the active site. (B) The effect of the TH on the energy profile of the translocational equilibria. Green horizontal lines aid comparison of the energy minima. The heights of the activation energy barriers (Ea) are not to scale (See Supplementary Figure S7B). Ea superscripts REC, BKT, FWD and BWD stand for the recovery, backtracking, forward and backward translocation, respectively. The energy profile corresponds to the 6AP-TEC: the relative depths of energy minima vary with the transcribed sequence.

