Figure 6.
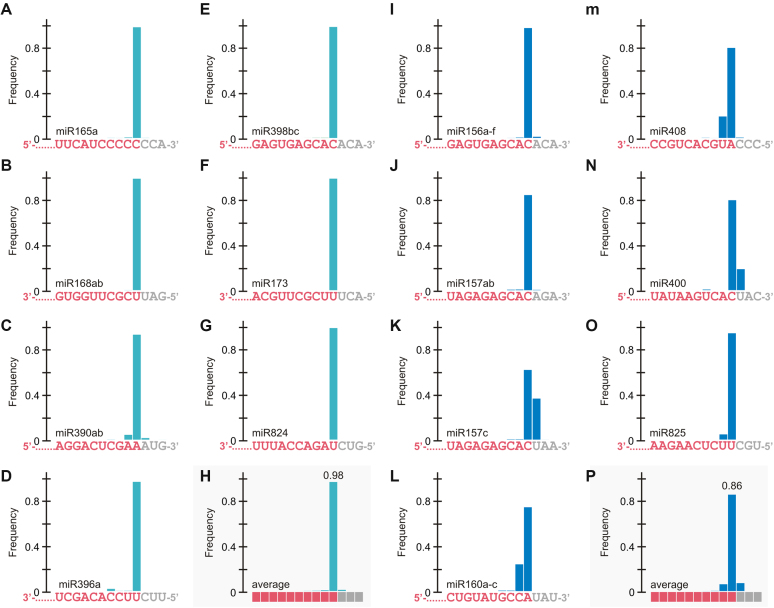
Small RNA sequence variation caused by variability in the position of the first cut. (A–P) miRNAs for which the biogenesis is base-to-loop are displayed on the left panels (turquoise bars) (A–H), while loop-to-base miRNAs are displayed on the right panels (blue bars) (I–P). (A) miR165a, (B) miR168ab, (C) miR390ab, (D) miR396a (E) miR398bc (F) miR173, (G) miR824, and (H) average base-to-loop miRNA; (I) miR156a-f, (J) miR157ab, (K) miR157c, (L) miR160a-c, (M) miR408, (N) miR400, (O) miR825, (P) average loop-to-base miRNA. The miRNA sequence is indicated below each graph. The bar shows the frequency of the small RNAs ending at that position. For the average miRNA (H and P) the bases are depicted as squares.

