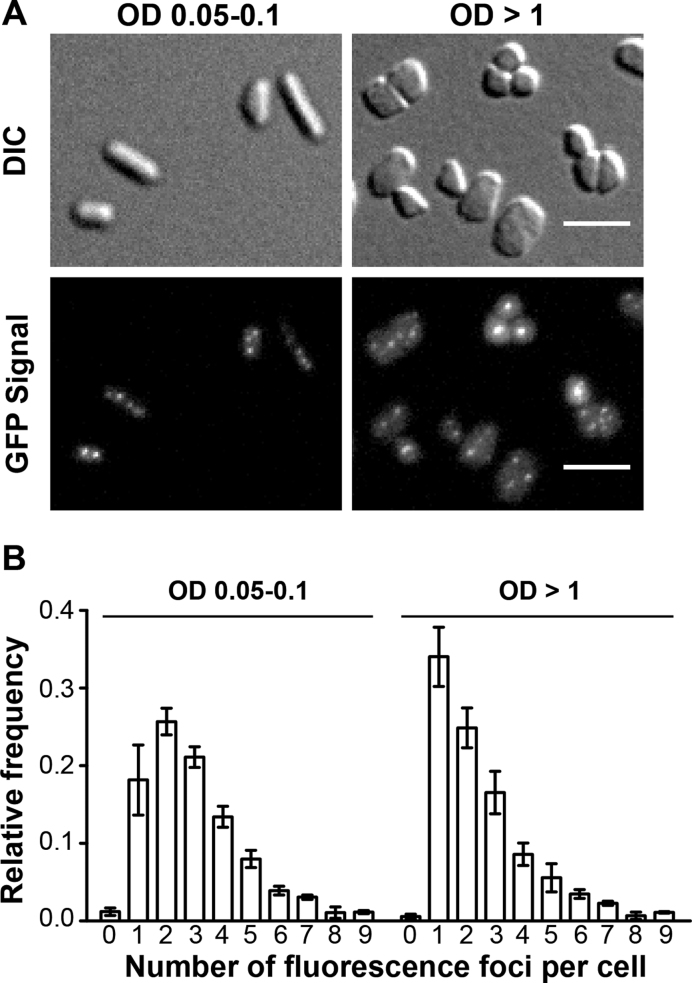
Figure 2.
In vivo localization of GFP-labeled RPA2 under normal growth condition. A total of 391 cells at OD 0.05–0.1 and 1597 cells at OD >1 were analyzed. (A) Images of DIC and GFP signal of gfp+::rpa2+ cells at OD 0.05–0.1 and at OD >1 are indicated. A scale bar equals 5 μm. (B) Relative frequency of number of foci per individual cell is shown. Error bars represent standard deviations of at least three independent experiments.

