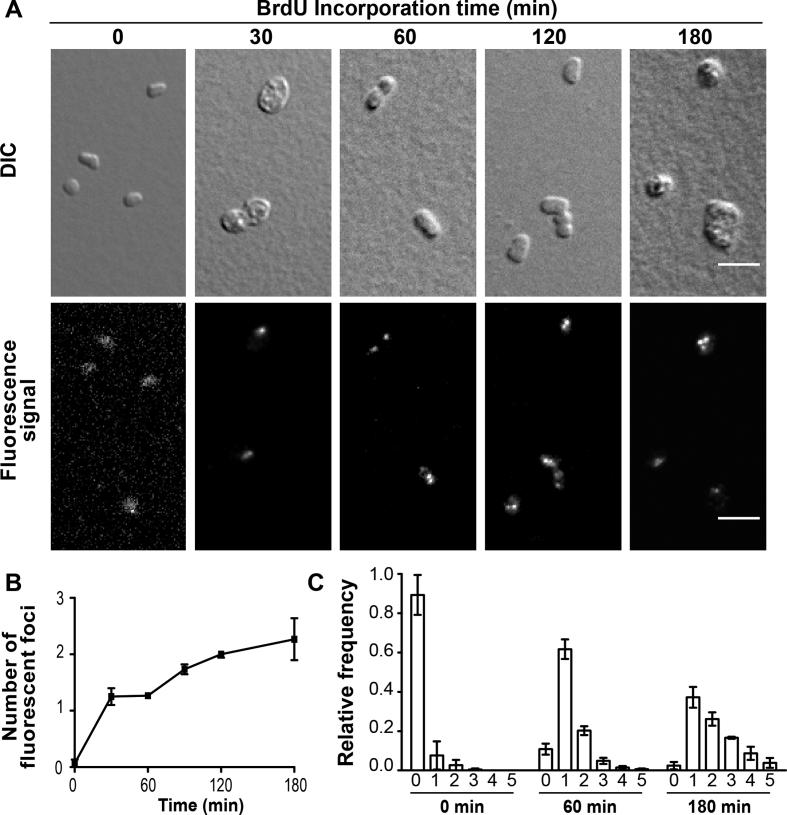
Figure 3.
Intracellular localization of nascent DNA. A total number of 163 cells were analyzed at the starting time point of BrdU incorporation, 139 after 30 min, 281 after 60 min, 951 after 120 min and 260 after 180 min. (A) DIC images and Alexa 488 signal of anti-BrdU antibody of Δhts ΔhdrB cells grown in rich media containing 100 μM BrdU. A scale bar equals 5 μm. (B) Mean number of nascent DNA foci formed observed using BrdU labeling and immunodetection of fixed cells. (C) Relative frequency of number of nascent DNA foci per individual cell. Error bars represent standard deviations of at least three independent experiments.

