Figure 4.
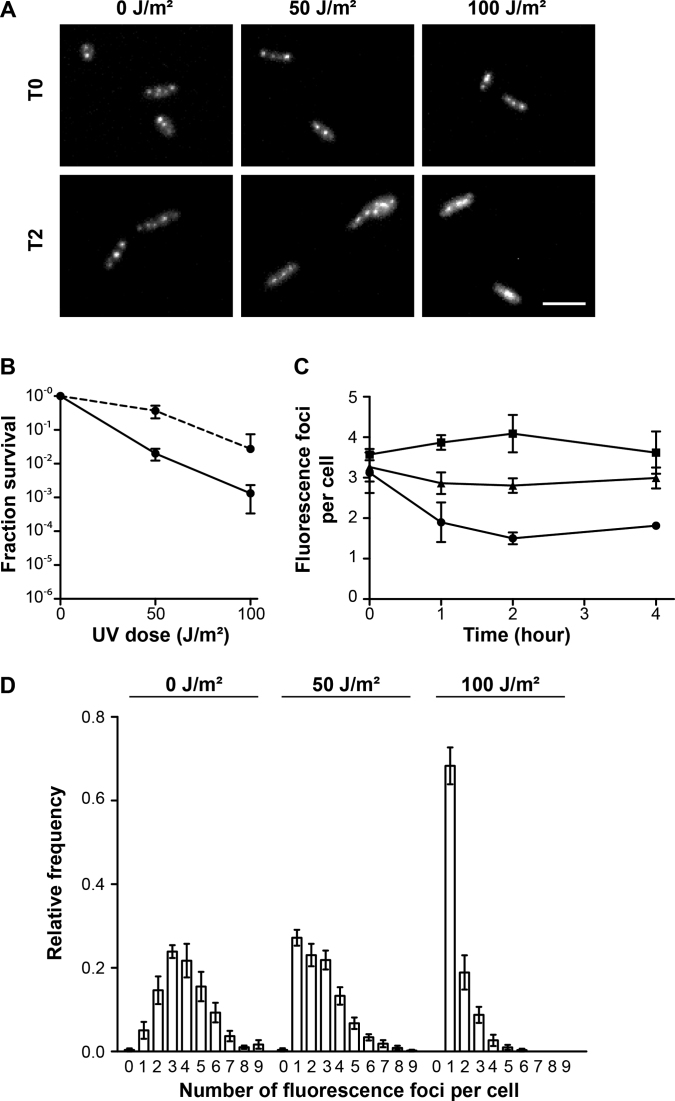
In vivo localization of GFP-labeled RPA2 after UV irradiation. A total of 391 cells at OD 0.05–0.1 and 1597 cells at OD >1 were analyzed. (A) Images of GFP signal of gfp+::rpa2+ cells unirradiated (0 J/m²) or after 50 and 100 J/m² UV irradiation, without recovery (T0) and after two hours recovery (T2). A scale bar is equal to 5 μm. (B) Surviving fractions of gfp+::rpa2+ cells in response to increasing doses of UV irradiation performed on plated cells (dotted line, as in Figure 1B) and in liquid cultures (continuous line). (C) The average number of fluorescence foci per cell as a function of time in unirradiated cells (▪) and after 50 (▴) and 100 J/m² (•) UV irradiation. (D) Relative frequency of number of foci per individual cell after 2 h recovery. Error bars represent standard deviations of at least three independent experiments.

