Figure 5.
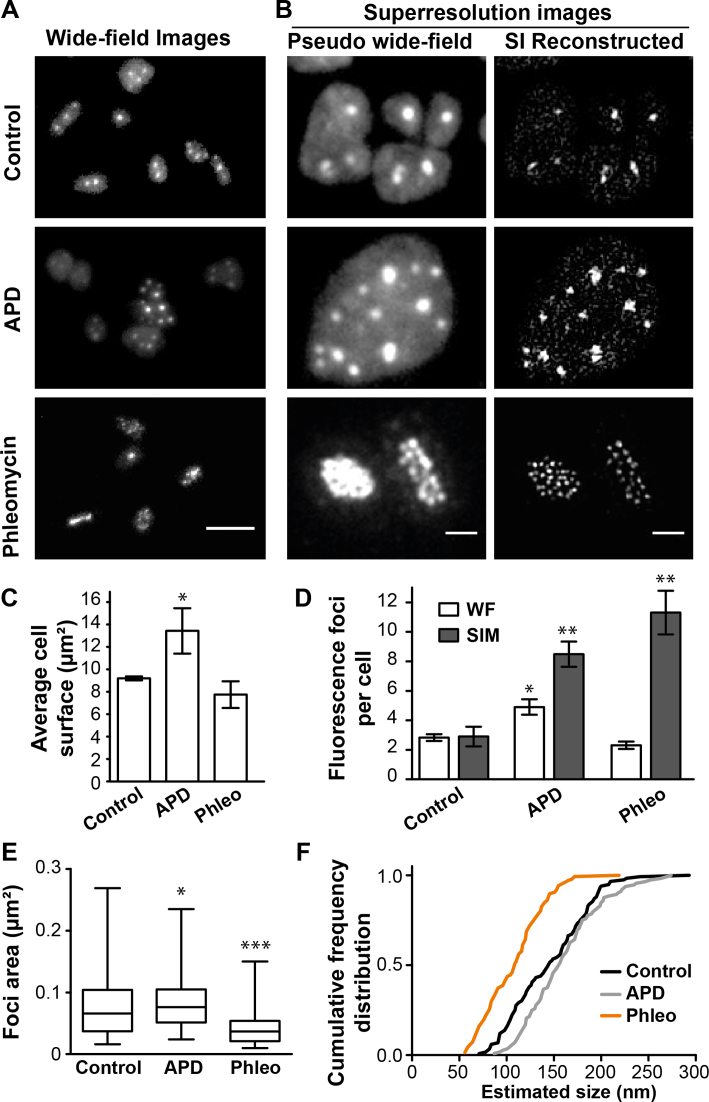
In vivo localization of GFP-labeled RPA2 using SIM microscopy. A total of 144 control cells, 75 cells exposed to 5 μg/ml aphidicolin, and 116 cells exposed to 100 μg/ml phleomycin, were analyzed. (A) Images of GFP signal of gfp+::rpa2+ cells using wide-field microscopy. Bar equals 5 μm. (B) Images for each condition of GFP signal of gfp+::rpa2+ cells using SIM microscopy, comparing pseudo-wide field (PWF) image with the image obtained after SIM reconstruction. Bar equals 1 μm. (C) Average cell surface. (D) Mean number of GFP-RPA2 labeled fluorescence foci obtained when analyzing PWF images (light histograms) and SIM images (grey histograms). (E) Foci area measured on images after SIM reconstruction. A total of 116 foci were analyzed for control cells, 112 for cells exposed to aphidicolin and 140 for cells exposed to phleomycin. (F) Cumulative frequency distribution of the foci size estimates approximated as circles. Error bars represent standard deviations of at least three independent experiments. Unpaired t-test with Welch's correction were performed in comparison to control cells. ***Significantly different, P < 0.001; **Significantly different, P < 0.01; *Significantly different, P < 0.05.

