Figure 6.
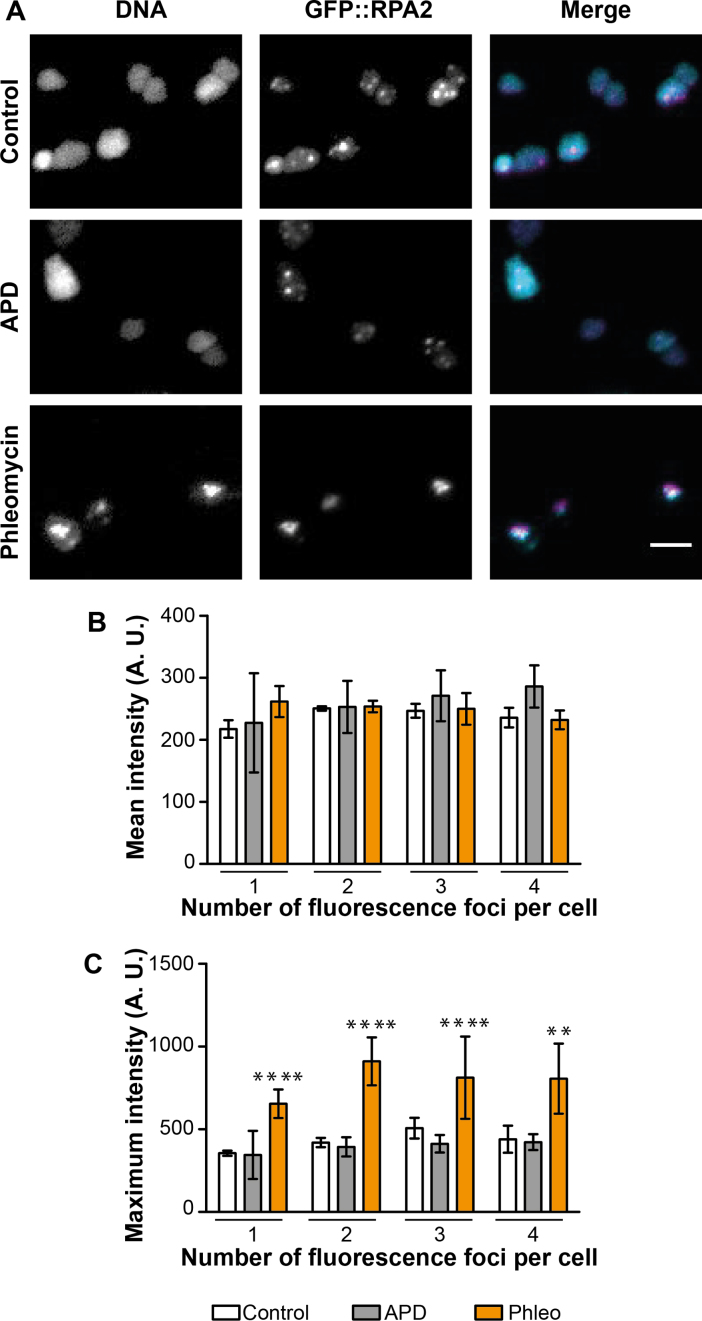
In vivo localization of Hoechst-labeled DNA and GFP-labeled RPA2 using wide-field microscopy. A total of 274 control cells, 159 cells exposed to 5 μg/ml aphidicolin, and 389 cells exposed to 100 μg/ml phleomycin, were analyzed. (A) Images for each condition of the Hoechst-labeled DNA, the GFP signal and the merge image of the DNA signal in cyan and the GFP signal in magenta. Bar equals 5 μm. (B) Mean intensity (A.U.) and (C) Maximum intensity (A.U.) of the Hoechst-labeled DNA signal in cells depending on the individual number of GFP::RPA2 foci. Light histograms correspond to control cells, grey ones to aphidicolin-treated cells and orange ones to phleomycin-treated cells. Error bars represent standard deviations of at least three independent experiments. Unpaired t-test with Welch's correction were performed in comparison to control cells. ****Significantly different, P < 0.0001; **Significantly different, P < 0.01.

