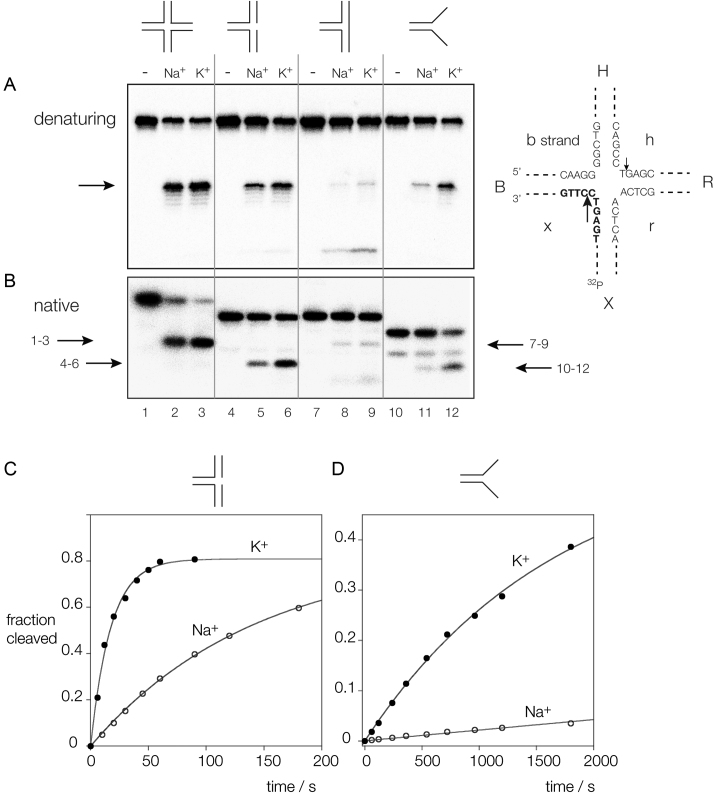
Figure 1.
Cleavage of branched DNA substrates by CtGEN1 as a function of the monovalent metal ion present. Substrates radioactively [5′-32P]-labeled on the x strand were incubated with CtGEN1 in buffer containing 10 mM cacodylate (pH 6.5), 1 mM MgCl2, 50 mM NaCl or KCl, 0.1% BSA for 3 min at 37°C. The products separated by polyacrylamide gel electrophoresis followed by phosphorimaging. (A) Denaturing gel electrophoresis. The major product of cleavage is arrowed. Note that each substrate is cleaved at the same position. The scheme on the right shows the sequence of the core of the junction, and the nomenclature of the arms and strands. The position of the radioactive label is indicated and the cleavage sites are arrowed. The major cleavages are made in the B and R arms, 1 nt 3′ to the point of strand exchange on the h and x strands. In this experiment the x strand is radioactively [5′-32P]-labeled, and thus only cleavage in this strand is detected. (B) Native gel electrophoresis. The products of CtGEN1 cleavage are arrowed, with the relevant tracks indicated; e.g. the arrow labeled 1–3 indicates the product of four-way junction cleavage. In A and B tracks 1–3 contain the four-way junction (4H), tracks 4–6 contain the nicked three-way junction, tracks 7–9 contain the three-way junction (3H) and tracks 10–12 contain the splayed helix junction. For each is shown no cleavage with CtGEN1 i.e. intact junction, tracks 1, 4, 7 and 10, cleavage with CtGEN1 in the presence of Na+ ions, tracks 2, 5, 8 and 11, and cleavage with CtGEN1 in the presence of K+ ions, tracks 3, 6, 9 and 12. (C) Progress curve for cleavage of a nicked three-way junction. (D) Progress curve for cleavage of a splayed helix junction. In both C and D cleavage in K+ and Na+ ions are indicated by closed and open circles, respectively. The data are fitted to single exponential functions (Equation 1; lines). Sequences and secondary structures are presented in Supplementary Figure S2 and Table S1.

