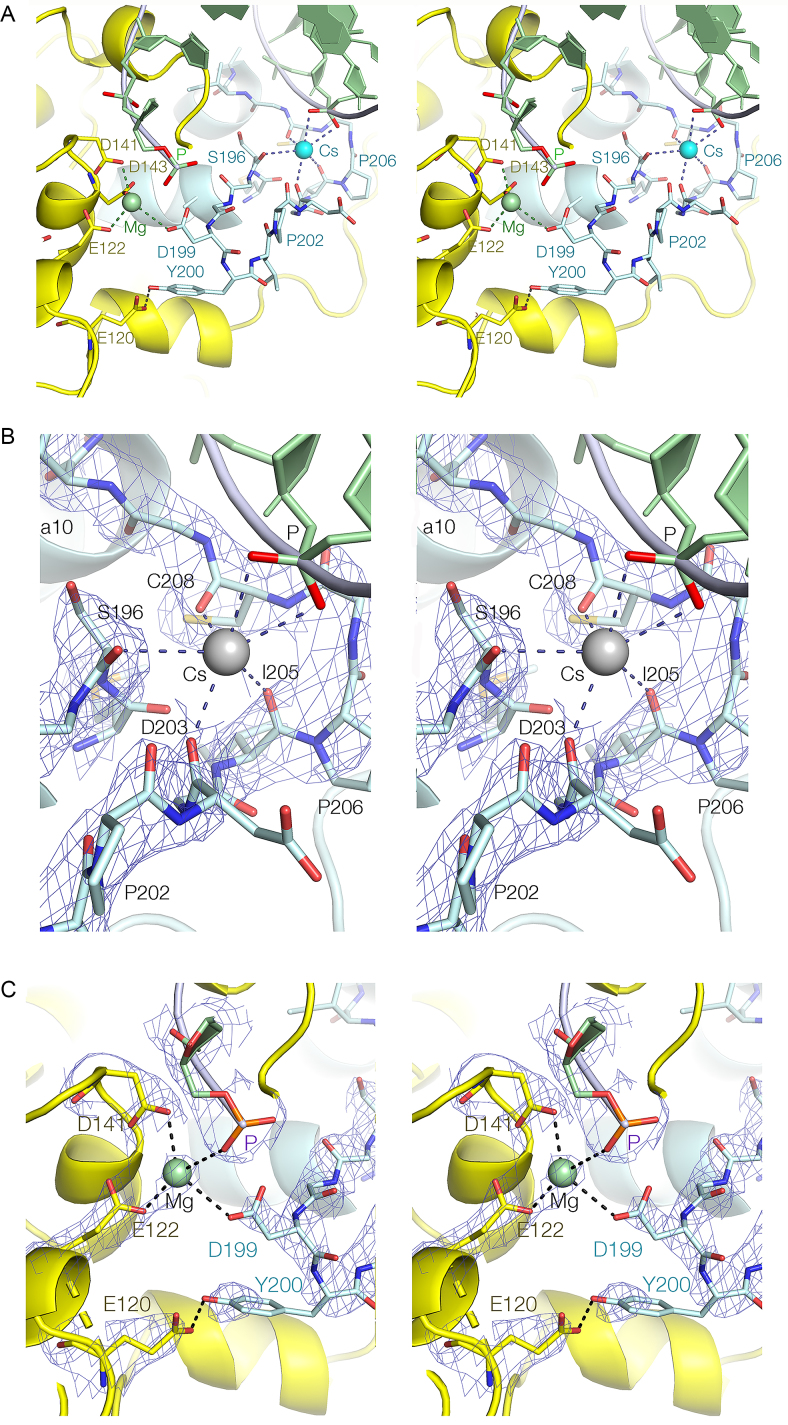
Figure 4.
The H2TH region of CtGEN1 bound to its resolution product with a bound Cs+ ion. Parallel-eye stereoscopic views are shown. ( A) The complete loop (cyan) showing the interaction with the active site. (B) The Cs+ binding site. (C) The interaction of the distal end of the H2TH loop with the active site. The Mg2+ ion (Mg, green) is the M2 ion of the active site. B and C show the 2Fo-Fc electron density map for the key components of the interactions.

