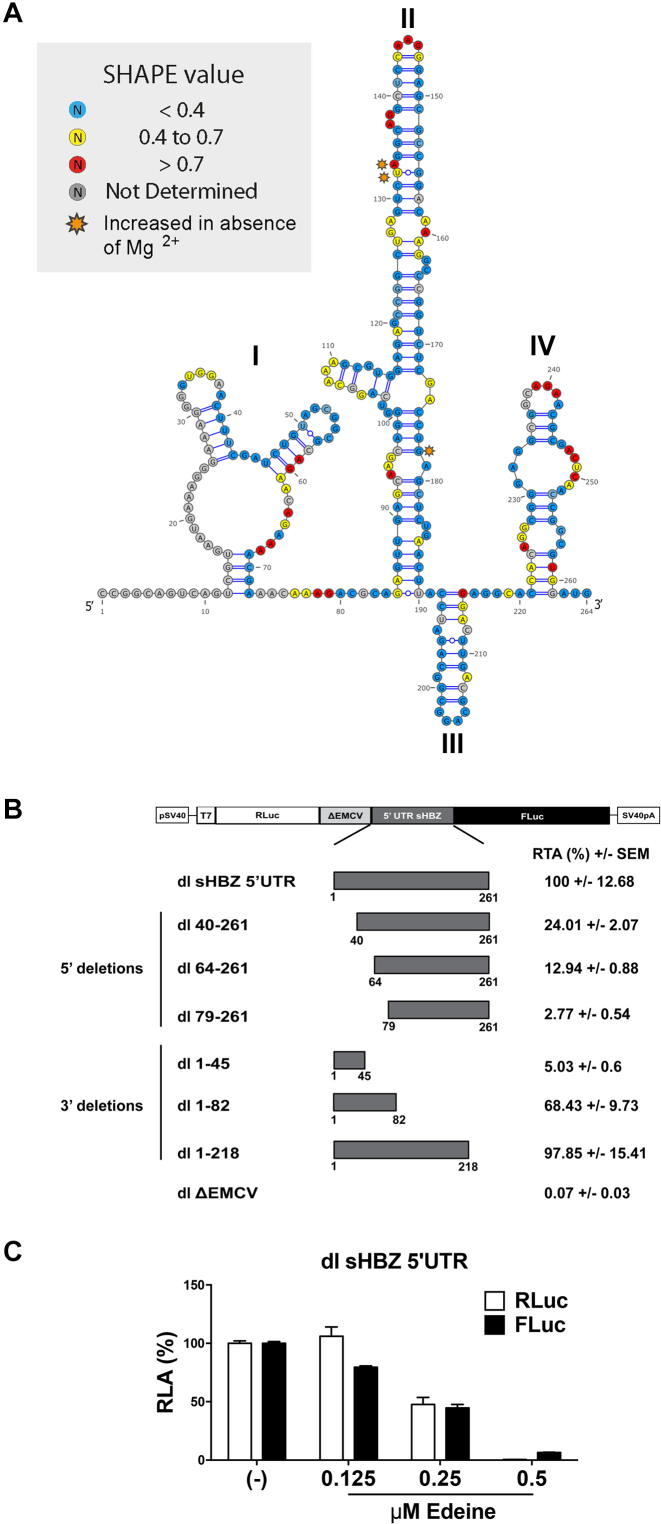
Figure 10.
The sHBZ IRES maps to the 5′end of the 5′UTR. (A) Secondary structure model of the sHBZ 5′ UTR determined by RNA selective 2′ hydroxyl acylation analysis by primer extension (SHAPE) using 1-methyl-7-nitroisatoic anhydride (1M7) or N-methylisatoic anhydride (NMIA) as a modifying agents. The proposed structure is based on the mean SHAPE reactivity from three independent experiments conducted for each modifying reagent. The SHAPE reactivity values for each position using numbering according to the HTLV K30 infectious clone (genbank: L03561) on the sHBZ 5′UTR are indicated for each position on the HBZ 5′UTR according to the color code boxed, with decreased SHAPE reactivity <0.4 (blue), 0.4–0.7 (yellow), increased SHAPE reactivity >0.7 (red) and nucleotides not measured indicated in (gray). Nucleotides that exhibited an increased SHAPE reactivity to 1M7 or NMIA in the absence of Mg2+ are indicated (orange). (B) Dual luciferase plasmids containing the indicated 5′ and 3′ deletions were constructed and transfected into COS-7 cells and luciferase activity was measured 24 h later. The dl ΔEMCV vector was used as a negative control for IRES activity. The results are presented as RTA (%) relative to the dl sHBZ 5′UTR, set to 100%. Values shown are the mean (+/− SEM) for three independent experiments, each performed in duplicate. (C) The m7G-capped in vitro transcribed dl sHBZ 5′UTR RNA reporters were translated in RRL in the absence (−) or the presence of increasing concentrations of edeine (0.125, 0.25 or 0.5 μM). RLuc and FLuc activities were measured and are shown as RLA (%) relative to the luciferase activity obtained in the absence (−) of edeine, set to 100%. Values shown are the mean (+/− SEM) for four independent experiments, each performed in duplicate.

