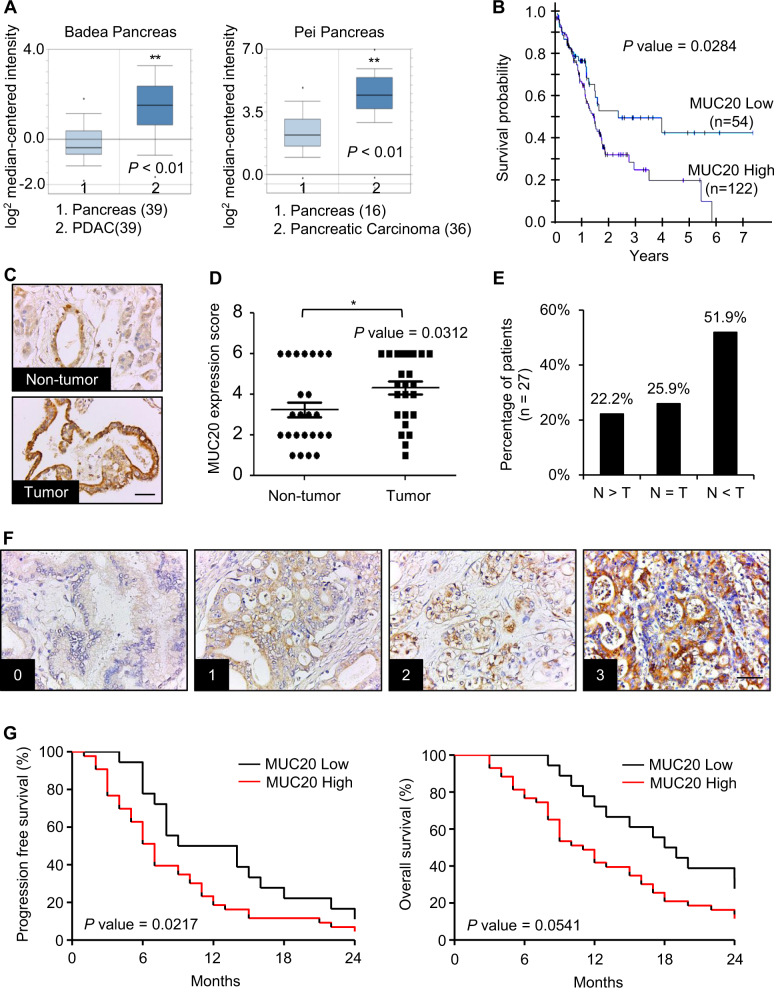
Fig. 1.
MUC20 is overexpressed in PDAC and MUC20 high expression correlates with poor survival. a MUC20 mRNA levels in Badea Pancreas and Pei Pancreas from the Oncomine database. b Correlation between MUC20 mRNA expression level and pancreatic cancer patient survival generated by the Cancer Genome Atlas (TCGA). MUC20 low (FPKM ≤ 6) and high (FPKM > 6) expression group contained 54 and 122 patient samples, respectively. c Representative images showing MUC20 overexpression in pancreatic tumour tissues compared with the adjacent non-tumour tissue by immunohistochemistry (IHC) of tissue microarray (US Biomax, Inc). Scale bar indicates 50 μm. d Scatter plot graph represents the MUC20 expression score in non-tumour and tumour portions of the pancreas. MUC20 expression was scored by multiplication of intensity (0–3) and positive area (1–3). Data are presented as mean (n = 27) ± SEM. P-value was the result of the paired t-test. *P < 0.05. e Statistics of MUC20 expression in paired PDAC tissue microarray. Abbreviations are: N adjacent non-tumour, T tumour. f Representative images showing the intensity of MUC20 expression in PDAC tumours. Scale bar indicates 100 μm. g Kaplan–Meier plots of progression-free survival (left) and overall survival (right). Log-rank test, P = 0.0217 and 0.0541, respectively. MUC20 low and high expression were scored 0–5 (n = 18) and scored 6–9 (n = 43), respectively

