Fig. 2.
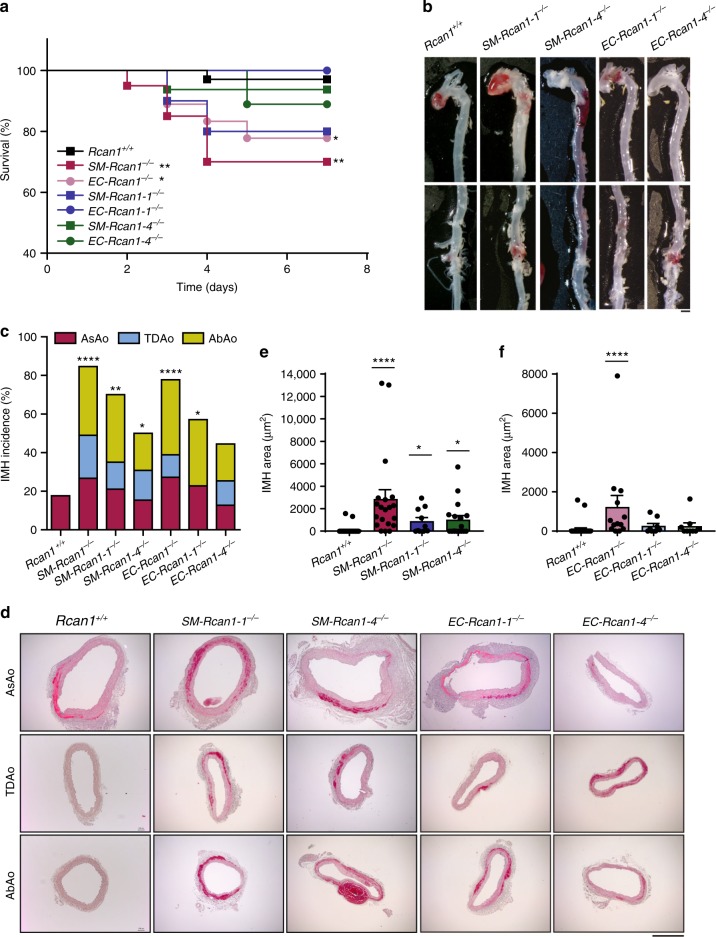
Rcan1-1 and Rcan1-4 contribute to aortic homeostasis. Six-eight-week-old SM-Rcan1-1−/− (n = 10), SM-Rcan1-4−/− (n = 16), EC-Rcan1-1−/− (n = 7), and EC-Rcan1-4−/− (n = 9) male mice were treated with AngII at the same time as the SM-Rcan1−/− (n = 20), EC-Rcan1−/− (n = 18), and control Rcan1+/+ (n = 39) mice described in Fig. 1. Quantitative data for SM-Rcan1−/−, EC-Rcan1−/−, and control Rcan1+/+ are therefore the same in both figures. a Survival curves. Log-rank (Mantel-Cox) test, **p < 0.01, *p < 0.05 vs. Rcan1+/+. All deaths were due to aortic rupture. b Representative images of macroscopic hematomas in aortas from mice euthanized at the end of the experiment. Scale bar, 1 mm. c IMH incidence in the AsAo, TDAo, and AbAo of the same mice. Chi-square distribution, ****p < 0.0001, **p < 0.01, *p < 0.05 vs. Rcan1+/+. d Representative images of hematoxylin-eosin staining of aortic sections from the indicated genotypes and IMH area quantification in aortic sections from e SM-Rcan1−/−, SM-Rcan1-1−/−, and SM-Rcan1-4−/− mice and f from EC-Rcan1−/−, EC-Rcan1-1−/−, EC-Rcan1-4−/−, and control Rcan1+/+ mice. Each data point denotes an individual mouse, whereas histograms denote means ± s.e.m. Kruskal-Wallis with Dunn multiple comparison post-hoc test, ****p < 0.0001, *p < 0.05 vs. Rcan1+/+. Scale bar, 500 µm. a–d Rcan1+/+ littermates consisted of a pool of vehicle-treated Cre-positive and tamoxifen-treated Cre-negative Rcan1fl/fl mice

