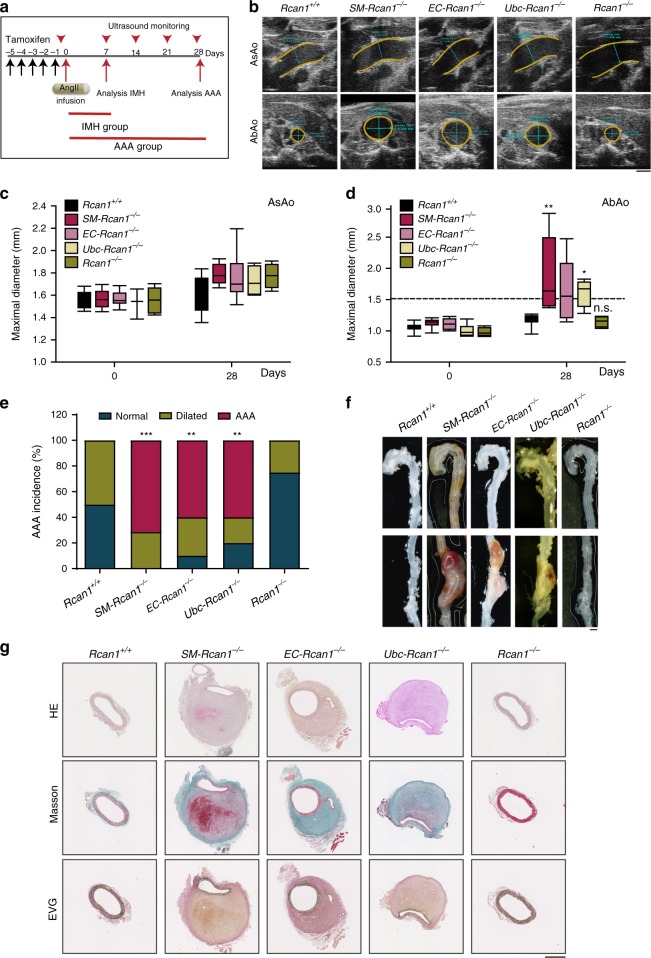
Fig. 3.
IMH progression into AAA in conditional Rcan1−/− mice. a Experimental design: 6–8-week-old male mice were treated with tamoxifen for 5 consecutive days (black arrows) before the implantation of osmotic minipumps for AngII infusion (1 μg kg−1 min−1). Aortas were monitored by ultrasonography (red arrowheads), and mice were euthanized after 7 or 28 days of treatment with AngII. Data from the analysis performed after 7 days are shown in Supplementary Figure 7. b Representative ultrasound images of AsAo and AbAo from mice treated with AngII for 28 days. Yellow and blue lines mark the lumen boundary and the lumen diameter, respectively. Scale bar, 1 mm. Maximal (c) AsAo and (d) AbAo diameter at the indicated times of AngII treatment. The boxes represent the 25th and 75th percentile range of the mean values, the line in the box shows the median value, and the whiskers extend from the minimum to the maximum value. Two-way ANOVA with Tukey multiple comparison post-hoc test (c) and Kruskal-Wallis with Dunn multiple comparison post-hoc test (d), **p < 0.01, *p < 0.05 vs Rcan1+/+; n.s., non-significant vs. Rcan1+/+. e Incidence of AAA and aortic dilation. Normal, diameter < 1.2 mm; Dilated, 1.2 mm < diameter < 1.5 mm; AAA, diameter > 1.5 mm. Chi-square distribution, ***p < 0.001, **p < 0.01, vs. Rcan1+/+. f Representative images of AAA. Scale bar, 1 mm. g Representative images of aortic sections stained with hematoxylin-eosin (HE), Masson’s trichrome (Masson) and Elastic Van Gieson stain (EVG). Scale bar, 500μm. Rcan1+/+ (n = 12), SM-Rcan1−/− (n = 7), EC-Rcan1−/− (n = 11), Ubc-Rcan1−/− (n = 6), and Rcan1−/− (n = 6). b–g Rcan1+/+ littermates consisted of a pool of vehicle-treated Cre-positive and tamoxifen-treated Cre-negative Rcan1fl/fl mice

