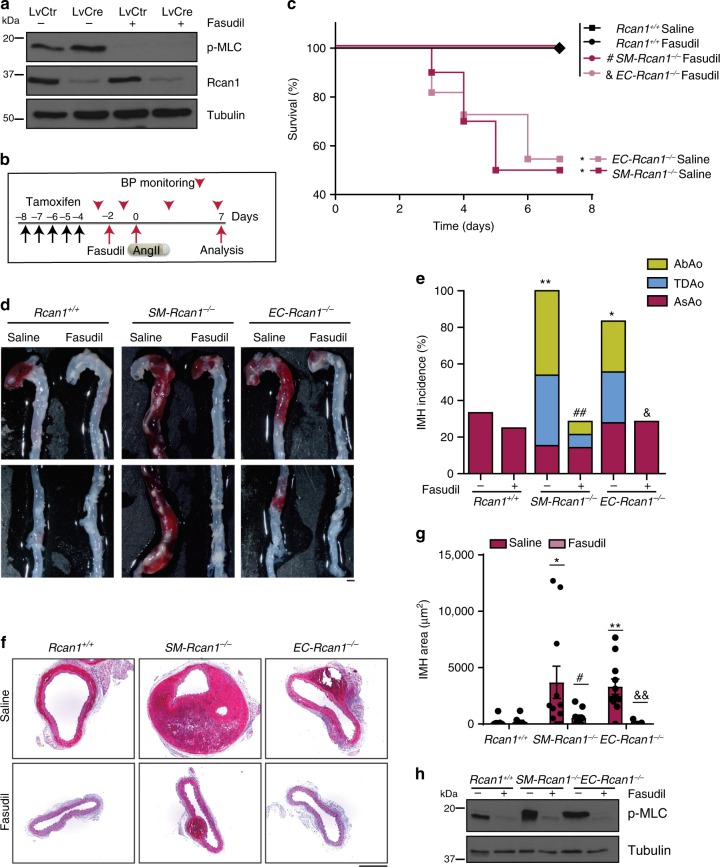
Fig. 7.
ROCK mediates MLC activation and aortic disease. a Representative p-MLC, Rcan1, and tubulin immunoblots of Rcan1fl/fl vSMCs transduced with Cre-encoding or control lentivirus and treated with the ROCK inhibitor Fasudil (30 µM) for 1 h (n = 3 independent experiments). b Experimental timeline. Black arrows, tamoxifen injection. A group of mice was treated with Fasudil (1 mg per ml in drinking water) starting 2 days before 7-day treatment with AngII. Red arrowheads, BP measurements. Red arrows, Fasudil start of treatment (−2), AngII osmotic minipump implantation (0), and end-of-experiment (7). c Survival curves of 6–8-week-old male mice treated according to the scheme in b as indicated. Saline = AngII-treated: Rcan1+/+ (n = 7), SM-Rcan1−/− (n = 10), and EC-Rcan1−/− (n = 11); Fasudil = Fasudil + AngII treated: Rcan1+/+ (n = 8), SM-Rcan1−/− (n = 7), and EC-Rcan1−/− (n = 11). Log-rank (Mantel-Cox) test, *p < 0.05 vs Rcan1+/+ AngII (Saline), #p < 0.05 vs. SM-Rcan1−/− AngII (Saline), &p < 0.05 vs. EC-Rcan1−/− AngII (Saline). All deaths were due to aortic rupture. d Representative images of aortas with macroscopic hematomas (scale bar, 1 mm) and e hematoma incidence in these mice. Chi-square distribution, *p < 0.05, **p < 0.01, vs. Rcan1+/+ Saline, ##p < 0.01 vs. SM-Rcan1−/− Saline, p < 0.05 vs. EC-Rcan1−/− Saline. f Representative images of HE staining in AbAo sections from these mice (scale bar, 500 µm) and g IMH area quantification in these sections shown as mean ± s.e.m.; each data point denotes an individual mouse. Kruskal-Wallis with Tukey Dunn multiple comparison post-hoc test, **p < 0.01, *p < 0.05 vs. Rcan1+/+ Saline, #p < 0.05 vs SM-Rcan1−/− Saline, &&p < 0.01 vs EC-Rcan1−/− Saline. h Representative p-MLC immunoblot of aortic extracts from the same mice. Tubulin was used as loading control. c–h Rcan1+/+ littermates consisted of a pool of vehicle-treated Cre-positive and tamoxifen-treated Cre-negative Rcan1fl/fl mice

