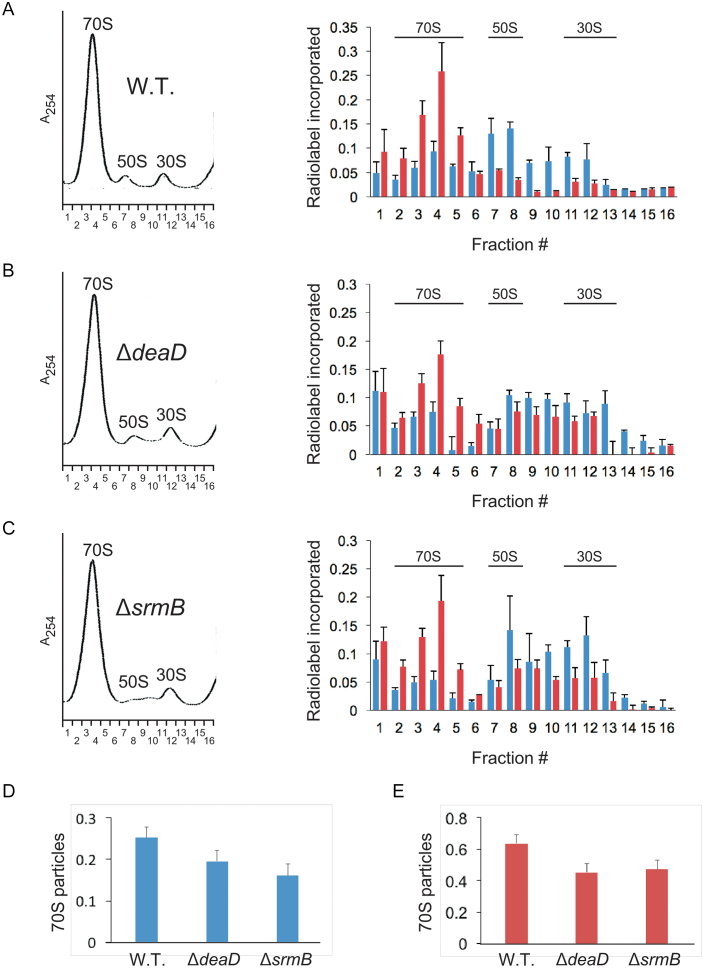
Figure 5.
Ribosome assembly kinetics. (A–C) Cultures of WT (A), ΔdeaD (B) or ΔsrmB (C) strains were pulse-labeled with 32P inorganic phosphate for 1 min. Aliquots of the cultures were removed thereafter 5 or 15 min post-labeling and combined with unlabeled cells. Lysates derived from these cells were individually layered on 14–32% sucrose density gradients and ultracentrifuged. (Left) Ribosome profiles were determined at 254 nM. The positions of the peaks corresponding to the 30S and 50S ribosomal subunits, and to 70S ribosomes, are indicated. Sixteen ribosomal fractions were collected in each case. A254, absorbance at 254 nM; (right) The ribosomal fractions were filtered through nitrocellulose membrane to capture labeled rRNAs present in ribosomal particles. The amount of radioactivity in each fraction was quantified by phosphorimaging of the dried membranes. Blue bars, relative amount of radiolabel in each fraction for cultures harvested 5 min after labeling; red bars, radiolabel incorporation for cultures harvested after 15 min of labeling; n = 3. The main fractions that correspond to the 70S, 50S and 30S particles are indicated. (D and E) The amount of radiolabel in 70S particles (fractions 2–5), relative to the total amount of radiolabel present in all fractions, was quantified for WT, ΔdeaD and ΔsrmB strains for cultures harvested 5 min (D) or 15 min (E) after labeling.

