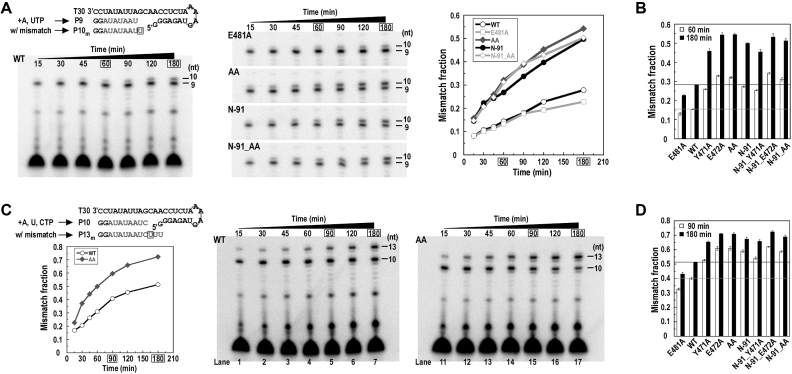
Figure 4.
NS5B fidelity characterization using the G:Umis and C:Umis assays. (A) Monitoring the G:Umis in a time course manner for five representative NS5B constructs. The mismatch fraction ([P10m]/([P9]+[P10m])) values were calculated to generate the line plot, where P10m is the G:Umis derived 10-mer product and P9 is the regular 9-mer product under the experimental setting. (B) Monitoring the G:Umis at two representative reaction time points. Each data series was taken from three individual experimental sets. Average mismatch fraction and standard deviation are shown in the column chart. The two time points (60 min and 180 min) in the panel-A experiments chosen for tests in panel B were circled by rectangles. (C) Monitoring the C:Umis in a time course manner for two representative NS5B constructs. The mismatch fraction ([P11m-P13m]/([P10–13m])) values were calculated to generate the line plot, where P10 is the regular product and P11m – P13m are the C:Umis derived 11–13-mer products under the experimental setting. (D) Monitoring the C:Umis at two representative reaction time points. Each data series was taken from three individual experimental sets. Average mismatch fraction, standard deviation and gels from one set are shown in the column chart. The two time points (90 and 180 min) in the panel C experiments chosen for tests in panel D were circled by rectangles. For the column charts in panels B and D, one set of representative gels are provided in the Supplementary Figure S3, A and B, respectively.

