Figure 5.
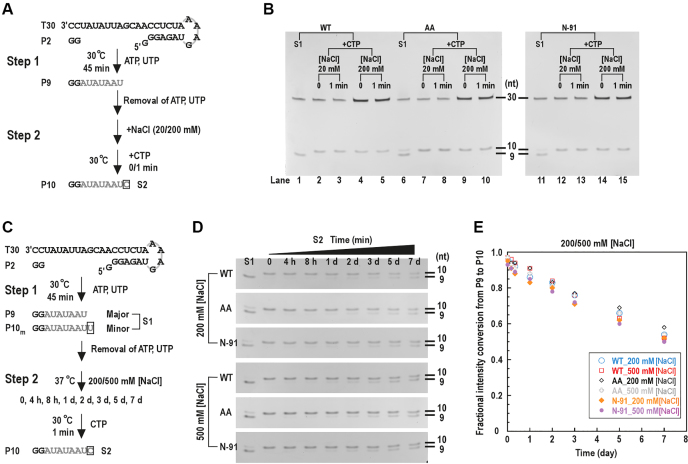
The processivity of NS5B EC was not affected by the NTD–RdRP interface mutations. (A) The reaction flow chart for the snG:C assays that revealed fast catalytic rate of P9 to P10 conversion. (B) In the snG:C assays, the P9 produced by NS5B constructs (WT, AA and N-91) in the first step rapidly extended to the P10 in the presence of the cognate nucleotide CTP under regular (20 mM) or high (200 mM) NaCl concentrations. (C) Reaction flow chart of the stability assays. (D and E) The P9-containing complexes formed by different NS5B constructs were incubated under high NaCl concentrations (200/500 mM) for different time period (up to 7 days) before the fraction of the complex survived the incubation was estimated by the fractional intensity conversion from P9 to P10 ([P10int – P10m,int]/[P9int + P10int – P10m,int], see details in Materials and Methods) plotted in panel E.

