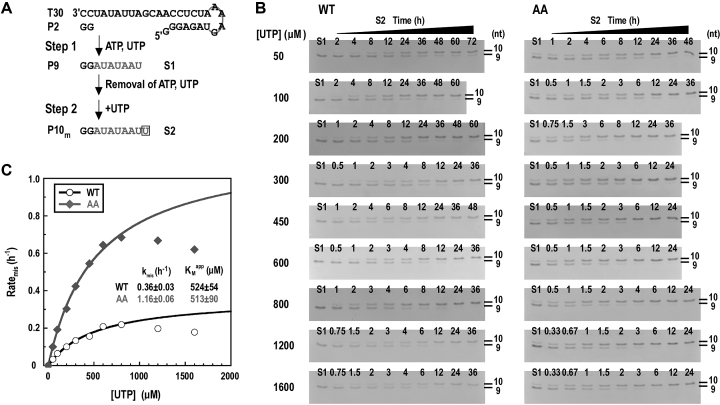
Figure 6.
NS5B fidelity characterization using the snG:Umis assays. (A) The reaction flow chart and products of the snG:Umis assays. (B and C) Monitoring the snG:Umis in a time course manner under a series of UTP concentrations for two representative NS5B constructs (WT and AA). The time course data under each UTP concentration were used to calculate the misincorporation rate (ratemis), and ratemis values were then fit to the Michaelis–Menten equation to generate the KMapp and kmis values. The data points circled by dashed oval were not included in the fitting due to the inhibitory effect observed under the highest two UTP concentrations.

