Figure 2.
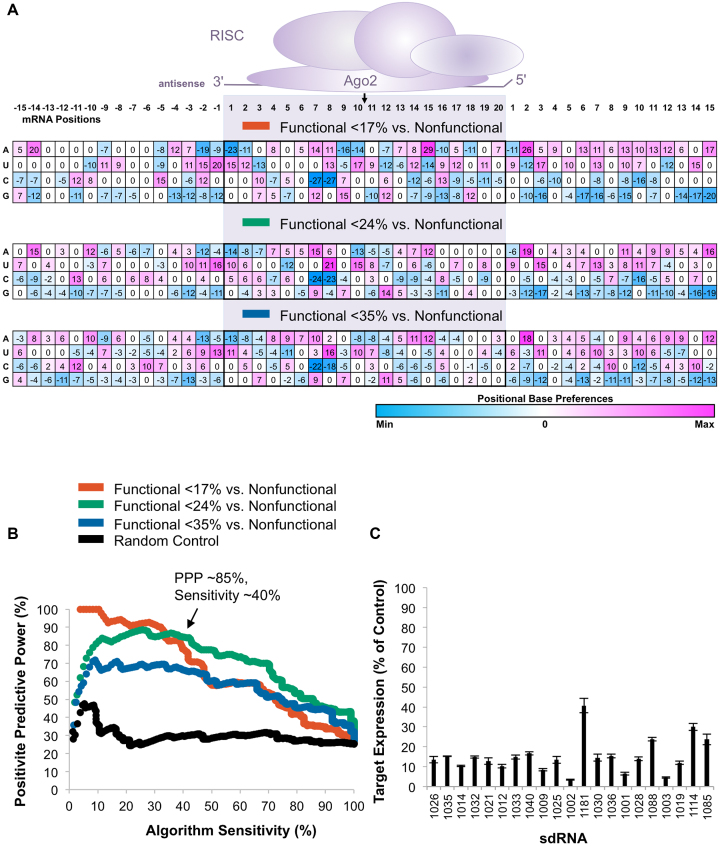
Development of an algorithm for the prediction of sdRNA efficacy. (A) The positional base preference matrix was generated using three functionality cutoffs (17%, 24% and 35% functional versus >44% non-functional compounds) for the 50-base regions comprising the siRNA-targeting site. Matrix weight values are color-coded by value as indicated by color bar below matrices. Analyzed mRNA positions corresponding to siRNA-targeting region (shaded) are indicated at the top. The location of cleavage site between positions 10 and 11 is indicated with a black arrow. (B) Using linear regression analysis (R 3.4.1), the scoring algorithm was generated for shown positional preference matrices (P < 0.001, see Materials and Methods). Algorithm performance is visualized as positive predictive power (PPP) versus sensitivity curves. PPP is calculated as the percent of correctly predicted (functional) sequences versus total predicted sequences for each algorithm value. Sensitivity is calculated as the percent of functional sequences selected vs total functional sequences present in the dataset for each algorithm value. sdRNA compounds with >44% gene expression remaining were defined as non-functional. The 17%/NF-preference matrix-based algorithm demonstrates the best performance with 96% PPP at 25% sensitivity. Black line shows performance of the control algorithm (see Methods). (C) The efficacy of individual sdRNA compounds selected by the 17%/NF scoring algorithm at 25% sensitivity (n = 3, mean ± SD). sdRNA IDs are indicated along the x-axis.

