Figure 7.
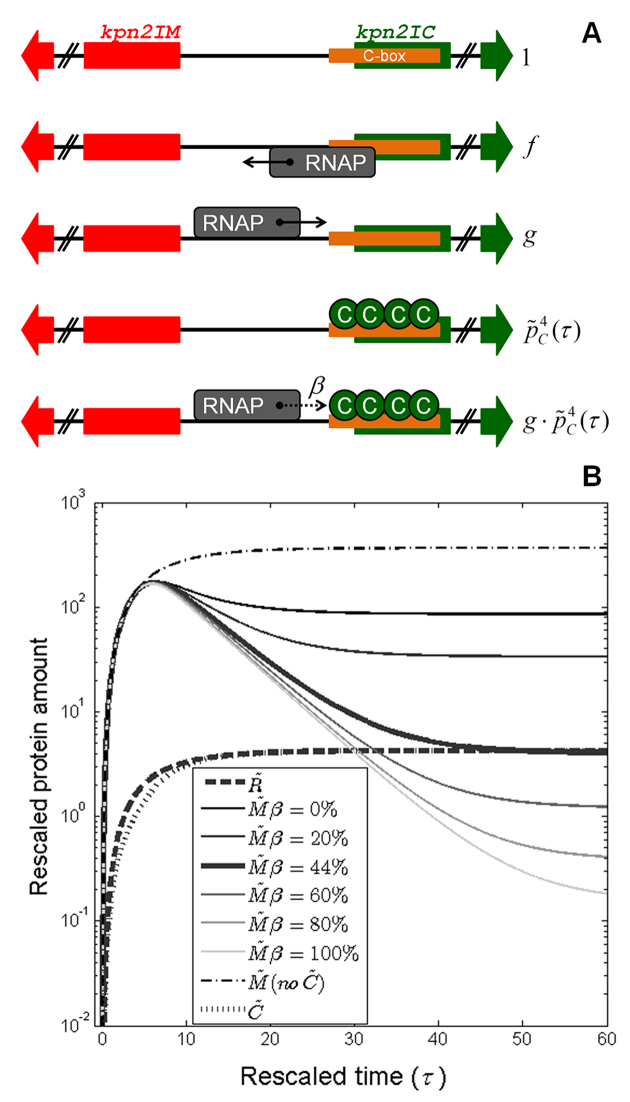
In silico prediction of Kpn2I system expression dynamics. (A) Modeling Kpn2I system transcription regulation. Allowed configurations of the common regulatory region separating divergently transcribed kpn2I.M (red arrow) and kpn2I.C (green arrow) genes are schematically presented, together with their corresponding statistical weights denoted on the right (detailed explanation in the main text). Direction of transcription by RNAP (gray rectangle) bound to a particular promoter is indicated by its associated arrow; the dotted arrow is associated with RNAP transcribing through a roadblock imposed by bound C.Kpn2I proteins (green circles) with probability β (indicated in the figure). (B) Change of the rescaled protein amounts with time during the system establishment in a naïve host is predicted by the quantitative model; the figure also predicts how appropriate perturbations, i.e., abolishing transcription control by C.Kpn2I, and perturbing the roadblock efficiency (changing β value), affect M.Kpn2I dynamics. Thick curves correspond to the wild-type system dynamics for: R.Kpn2I ( thick dashed), C.Kpn2I (
 thick dotted), and M.Kpn2I (
 thick full). Thin curves correspond to M.Kpn2I dynamics upon the following perturbations: (i) abolishing C.Kpn2I production (dash-dotted curve), (ii) changing β, where gradually increasing β corresponds to changing the curve shade from the darkest to the lightest – note that
  corresponds to the estimate for the wild-type system.

