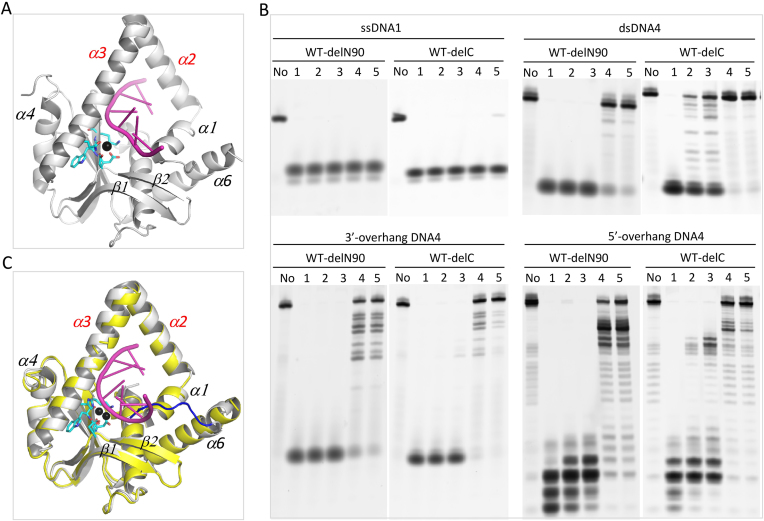
Figure 5.
Characterization of the N- and C- terminus of HsMGME1. (A) Overall structure of the H180Q-ssDNA2-Ca2+ complex. H180Q and Ca2+ are shown as cartoon and black sphere, respectively. DNA is shown as cartoon in magenta. (B) in vitro DNA cleavage assay using N- or C-terminus truncated HsMGME1. (C) Superposition of the HsMGME1-Mn2+ and HsMGME1-ssDNA2 complexes, showing the conformational change of the C-terminal region. DNA and protein are colored in magenta and yellow in the HsMGME1–ssDNA2 complex. In the HsMGME1–Mn2+ complex, Mn2+ ions are shown as black spheres, HsMGME1 is shown as cartoon in white, but the C-terminal region is colored in blue. DNA substrate concentrations are 0.8 μM. Truncated HsMGME1 concentrations are 0.8, 0.4, 0.2, 0.1 and 0.05 μM in lanes 1–5, respectively. No protein is present in the lane labelled with No.

