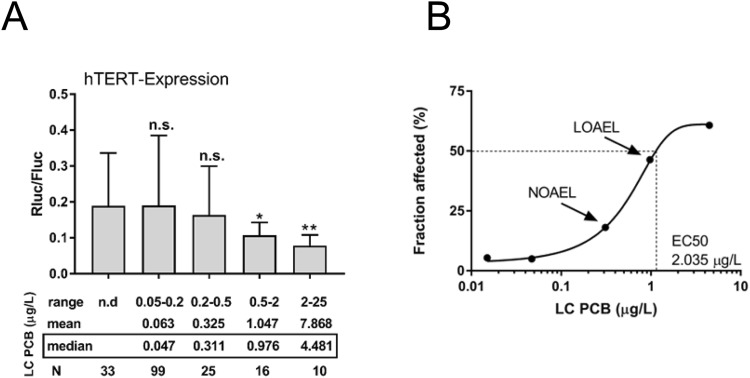
Figure 2.
Plasma level-response relationship of LC PCBs in tert + B6B5.1 cells. (A) Individual samples of the HELPcB-cohort were divided into five groups depending on plasma levels of LC PCBs. Mean Rluc/Fluc-ratio within each group was compared to the group with no detectable levels of LC PCBs. Statistical analysis was performed by a Mann-Whitney test. Statistically significant differences are indicated (*P = 0.05; **P = 0.003). (B) The plasma level-response logarithmic curve of LC PCBs in tert+ B6B5.1 cells.

