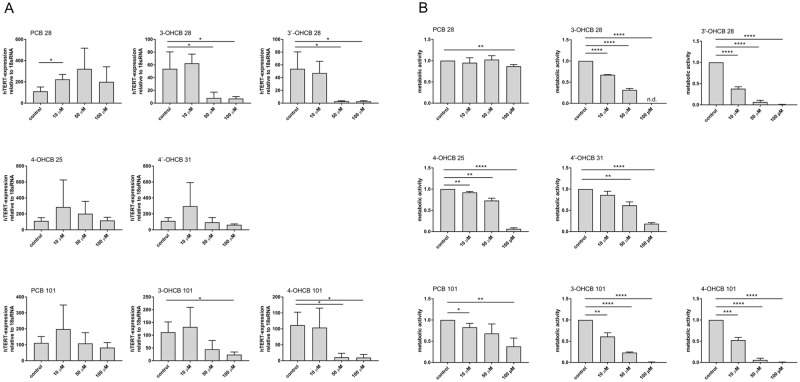
Figure 3.
hTERT inhibition and toxicity by activation of LC PCBs. (A) Jurkat T cells were treated with increasing concentrations of parent PCBs or OH-metabolites for 48 hrs. as indicated. hTERT mRNA expression was evaluated by RT-PCR with expression levels normalized against 18S rRNA. Mean ± SD of three different experiments each with a total of three replicates are shown. Statistical analysis was performed by an unpaired, two-tailed Student’s t-test. Statistically significant differences are indicated (*P < 0.05). (B) Jurkat T cells were incubated as described in (A). Mitochondrial and cellular viability were assessed by means of MTT-assay performed as described. Mean ± SD of three different experiments each with a total of three replicates are shown. Statistical analysis was performed by an unpaired, two-tailed Student’s t-test. Statistically significant differences are indicated (*P < 0.05; **P < 0.01; ***P < 0.0005; ****P < 0.0001).

