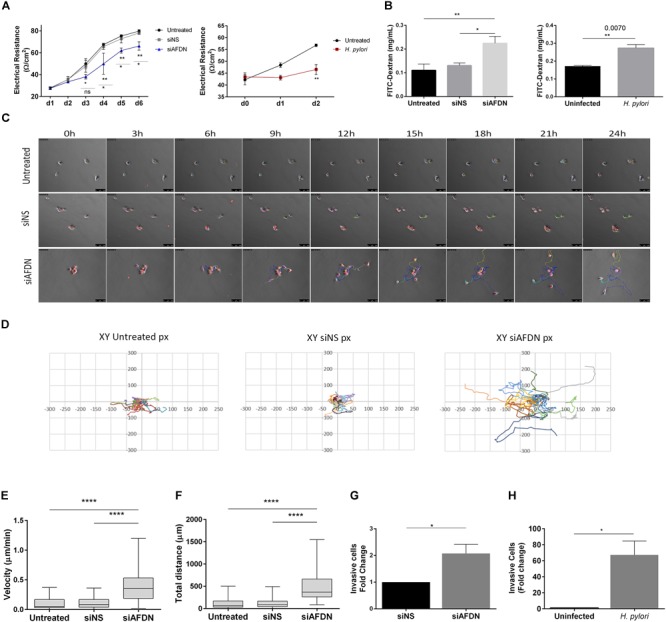
FIGURE 5.

Afadin downregulation alters the TJ barrier function and increases cell motility and invasion. (A) Transepithelial electrical resistance (TER) measurements of MKN74 gastric cells during a period of 6 days post Afadin silencing (siAFDN) in comparison with non-silenced (siNS) and with untreated cells, and during 2 days after H. pylori infection in comparison with uninfected cells. (B) Cell monolayer permeability to 4 kDa FITC-Dextran on day 6 post Afadin silencing and on day 2 after H. pylori infection. (C–F) Single cell motility analysis: (C) Time-lapse microscopy photos of cells during the 24 h period. (D) Representative graphs of the X and Y coordinates (in pixels, px) of each cell path, on a fibronectin coated surface. (E) Cell velocity in μm/minute and (F) total distance covered by and individual cell in μm. (G,H) Cell invasion capacity on Matrigel-coated transwells for MKN74 cells transfected with siNS control or transfected with siAFDN (G), and for MKN74 cells infected or not with H. pylori 26695 (H). Data are presented as mean ± SEM. Statistical significance was evaluated with the one- and two-way ANOVA and with Student’s t-test.
