Figure 5.

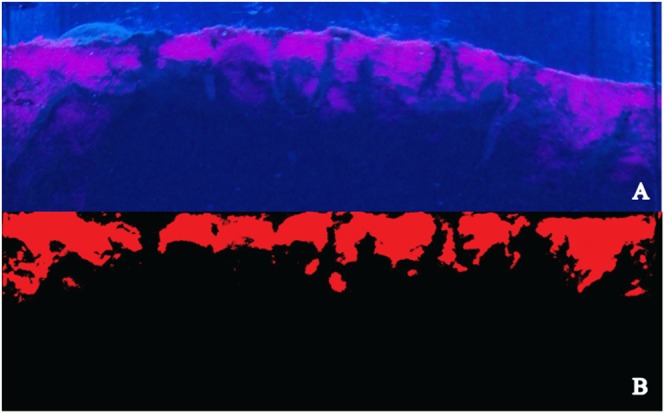
Image analysis for the quantification of luminophores showing (A) the original image with the sediment appearing in black and luminophore particles in pink, and (B) the processed image, showing the flattened sediment-water interface.

Image analysis for the quantification of luminophores showing (A) the original image with the sediment appearing in black and luminophore particles in pink, and (B) the processed image, showing the flattened sediment-water interface.