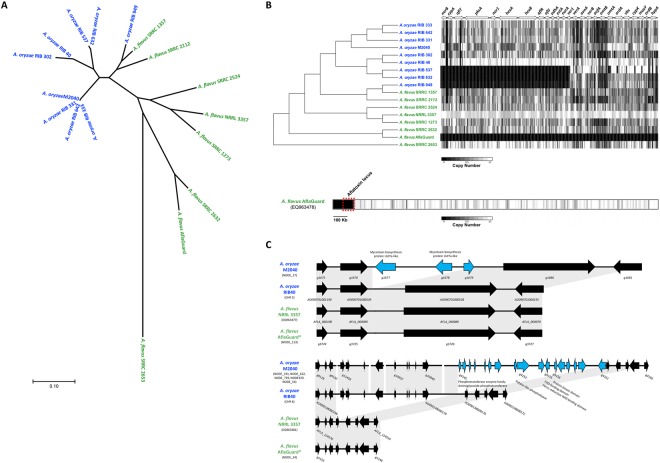
Figure 5.
Comparative genome analyses of A. oryzae M2040 and Afla-Guard. (A) Phylogenetic relationship of A. oryzae and A. flavus isolates. An unrooted phylogeny was generated using the Maximum Likelihood method from 305,543 SNPs across the entire genome. Branch lengths represent the number of substitutions per site. All bootstrap values were ≥94%. Blue and green taxa labels represent A. oryzae and A. flavus, respectively. (B) Deletion profiles in the AF gene cluster. The chromosomal architecture of the AFB1 gene cluster relative to the A. flavus NRRL 3357 genome is shown above the heatmap, where arrows represent genes, and their orientations represents the direction of transcription. The heatmap represents copy number estimates for each non overlapping 100 bp bin across the AF gene cluster. Black and white represent copy numbers of 0 and ≥1, respectively. Bottom bar shows the Afla-Guard heatmap depicting deletions relative to the AF gene cluster containing A. flavus NRRL 3357 EQ963478 scaffold. Windows represent copy number estimates for each non-overlapping 10 kb bin across the scaffold. The chromosomal region containing the AF cluster is outlined with a red box. (C) Genome architecture of examples M2040 lineage specific genes clusters. Microsynteny of regions covering a three gene (top) and 17 gene (bottom) cluster unique to the M2040 genome in comparison to A. oryzae RIB 40, A. flavus NRRL 3357 and Afla-Guard. For each cluster arrows represent genes, and their orientations represents the direction of transcription. Genes colored black are conserved in at least 2 isolates, while genes colored light blue are unique to the M2040 genome. Gray blocks represent genomic regions exhibiting sequence similarity between isolates. Chromosome, or scaffold identifiers containing these loci are listed under each isolate. Gene identifiers are listed for each gene in panel A, and for the range of genes in panel.

