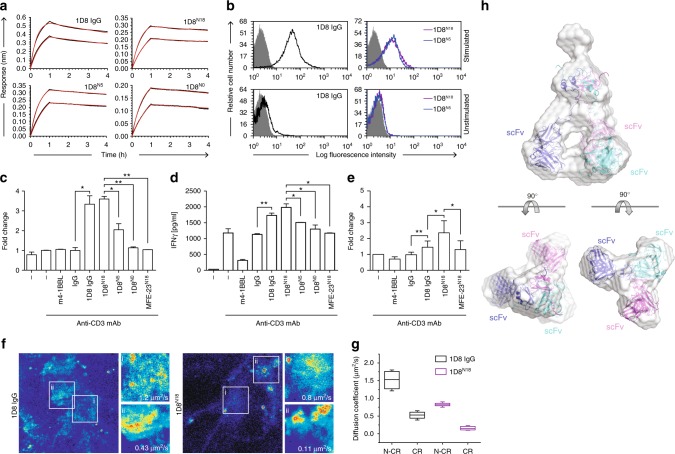
Fig. 2.
Characterization of anti-4-1BB trimerbodies. a Sensorgrams (black curves) and fitting curves for 1D8 antibodies (2 and 4 nM), obtained by biolayer interferometry with surface-immobilized m4-1BB. b The binding to 4-1BB on the cell surface of stimulated mouse CD8a+ T cells measured by FACS. c–e Costimulatory activity of anti-4-1BB antibodies. Mouse CD8a+ T cells were stimulated with immobilized anti-CD3 mAb in the presence of m4-1BBL, 1D8N5, 1D8N18, or 1D8 IgG, and proliferation (c) and secretion of IFN-γ (d) were measured after 48 h and cell viability (e) after 72 h. Data are reported as fold change relative to the values obtained from anti-CD3 mAb-stimulated CD8a+ T cells. Rat IgG2a and MFE-23N18 were used as controls. Data are mean ± SD (n = 3), *P ≤ 0.05, **P ≤ 0.01, Student's t test. f RICS analyses performed in living HEK293m4-1BB-S cells at regions containing clusters formed upon 1D8 IgG or 1D8N18 addition and at regions where clusters where not present (insert and zoomed-in regions ii, and i, respectively). Representative maximum intensity projection maps showing the RICS analyzed regions of interest. Values in the zoomed-in regions show the diffusion coefficient of bound antibody. The color heat map indicates in blueish tones the lower intensity and in redder tones the higher intensity. g Statistical analysis of the quantified diffusion coefficient obtained from 5 to 7 independent live cell experiments and 3–5 different regions of interest per cell (N-CR non-clustered region, CR clustered region). Data are presented as median (center line), upper and lower quartiles (boxes), and minimum-maximum (whiskers). h Arrangement of 1D8N18 trimerbody in solution, as determined by SAXS. Rigid-body overlaying of the ab initio-determined SAXS envelope for 1D8N18. The generated model (where each chain is colored in blue, magenta, or cyan) fits into the envelope (colored in pale gray)

