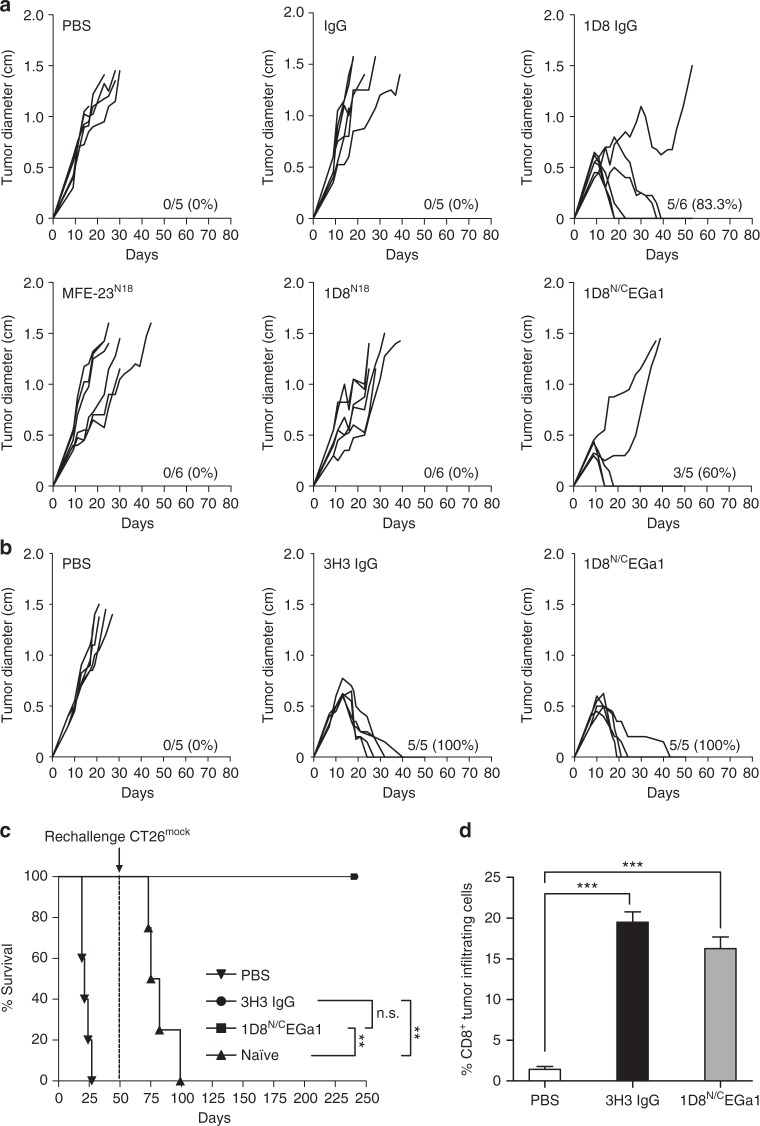
Fig. 5.
Induction of tumor regression in mice treated with 1D8N/CEGa1 trimerbody. a BALB/c mice inoculated s.c. with CT26hEGFR tumor cells (n = 6/group) were treated with three i.p. doses (4 mg/kg) of rat IgG2a isotype, 1D8 IgG, MFE-23N18, 1D8N18, 1D8N/CEGa1, or with PBS and monitored for tumor growth. Tumor diameter growth curves for individual mice in each treatment group are presented. The results are representative of two experiments identically performed. b BALB/c mice bearing CT26hEGFR tumors (n = 5/group) were treated with three i.p. doses of either PBS, 3H3 IgG, or 1D8N/CEGa1. c Kaplan–Meier survival curves of the 1D8N/CEGa1 trimerbody-treated mice (**P ≤ 0.01), log-rank (Mantel–Cox) test. Long-term survivors, following complete tumor rejection (b) were rechallenged with CT26mock cells (s.c.) 50 days after i.p. injections of 3H3 IgG or 1D8N/CEGa1 trimerbody. As a control group, tumor naive mice developed tumors in every case. d Quantitative analysis of intratumoral CD8+ T cells in paraffin-embedded mouse tumor tissue (n = 3/group) by immunohistochemistry. Data were calculated as percentage of CD8+ versus total cell number and presented as mean ± SD. ***P ≤ 0.001, Student's t test

