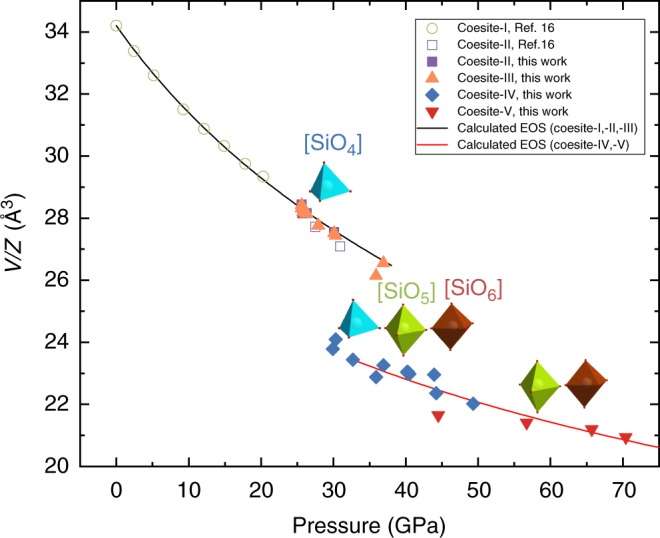
Fig. 1.

The P–V data of squeezed coesite. Unit cell volumes are normalized to the number of formula units Z. Open symbols represent literature data15,16 (in the present work, we used samples of the same coesite which was studied in refs.15,16). The black solid line represents a fit of all the VP-data for coesite-I, II, and III with the Birch–Murnaghan equation of state (EOS) (V0/Z = 34.20(1) Å3, K0 = 103(2) GPa, and K´ = 3.02(15)). Combined pressure–volume data for coesite-IV and coesite-V were fitted with the second-order Birch–Murnaghan equation of state (V32.7/Z = 23.44(3) Å3, K32.7 = 254(9) GPa) and are shown on the graph by a solid red line. Colored polyhedra indicate the building blocks characteristic for the structures of silica polymorphs in the corresponding pressure regions. Uncertainties in the unit cell volumes are less than the symbol sizes and are therefore not shown. As seen, coesite-III and coesite-IV show significant scatter in values of the unit cell volumes that might be attributed to different deviatoric stresses in samples from different runs
