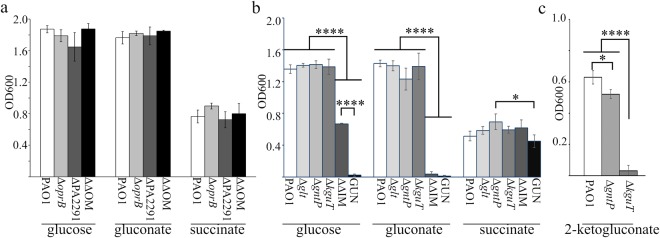
Figure 2.
Growth of glucose uptake mutants with different carbon sources. PAO1 and mutant strains were inoculated at the same OD600 in M9-Triton X-100 supplemented with either 0.4% glucose, 0.4% gluconate, 0.1% 2-ketogluconate or 0.5% succinate, as indicated below the bars. Bacterial cell density (OD600) was measured after aerate incubation for 24 h at 37 °C. The bars represent average (n = 3) with standard deviation (SD). (a) OM mutants. ΔΔOM, ΔoprB ΔPA2291 mutant. (b). IM mutants. ΔΔIM, ΔgntP ΔkguT mutant. (c). Growth in 0.1% 2-ketogluconate of the indicated mutants. (a,b) Significance was evaluated with One-way Anova and Tukey post-hoc test. (a) According to one-way Anova analysis, growth differences were not statistically significant at 0.05 level. (b,c). *P < 0.5; ****P < 0.0001. All comparisons for which P is not shown were not significant at 0.05 level.

