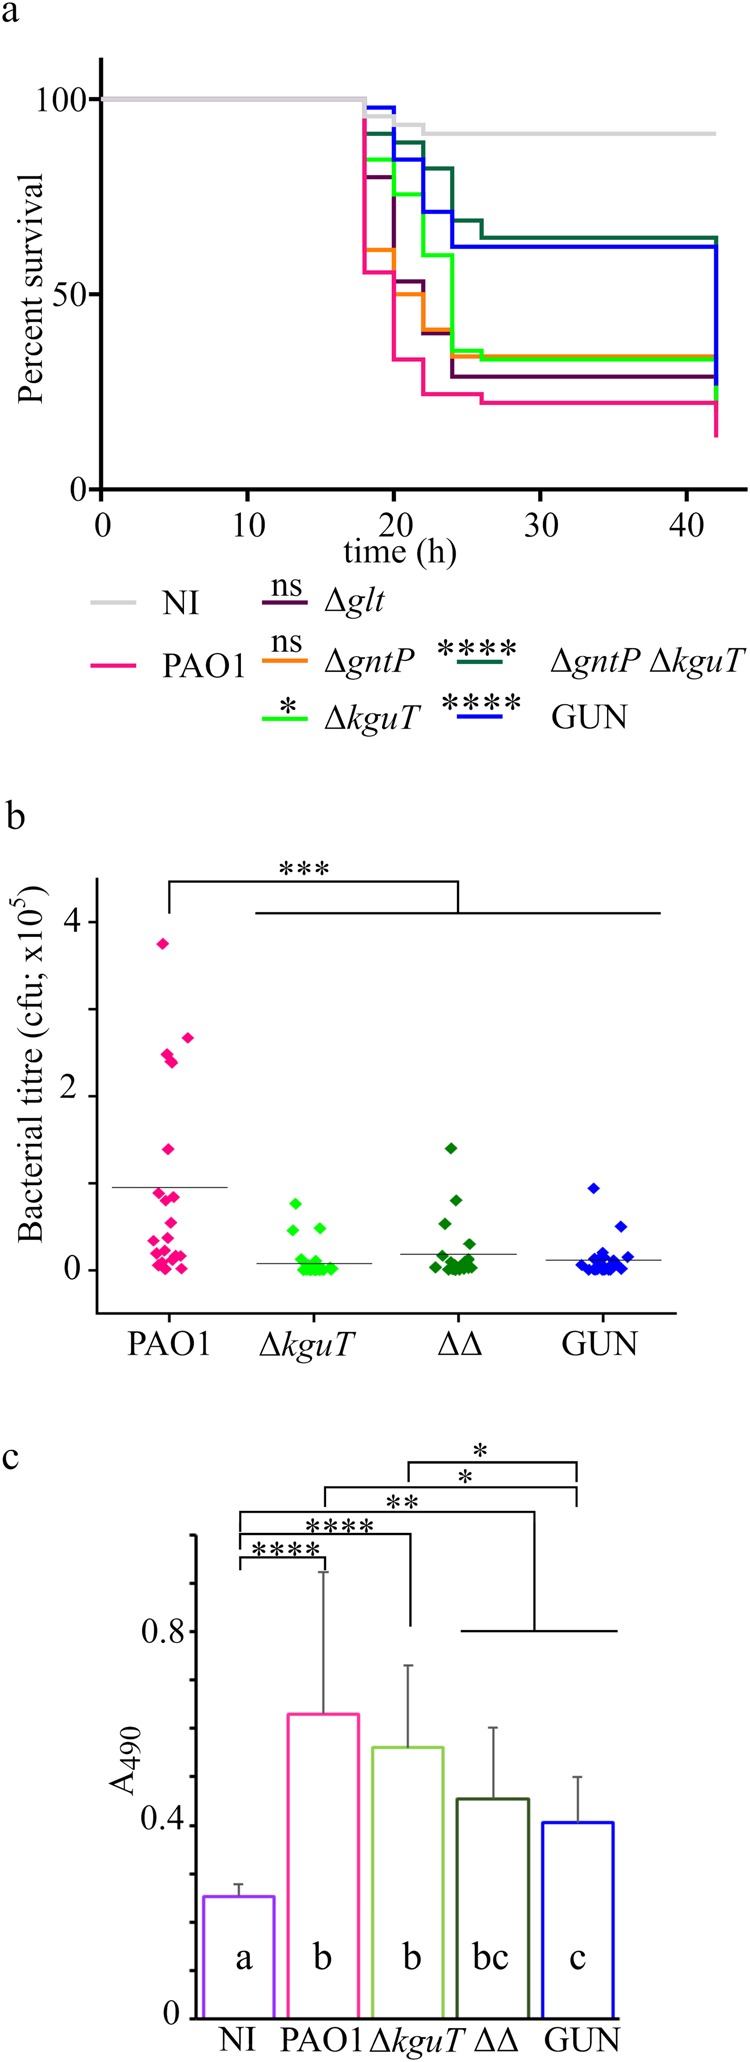
Figure 6.

G. mellonella infection assay. (a) Survival curves of G. mellonella larvae infected with glucose uptake mutants. Kaplan-Meyer curves represent results deriving from three independent experiments in which groups of 15 larvae were injected with the indicated strains. The average number of P. aeruginosa cells injected was 26 ± 5 (PAO1), 31 ± 6 (Δglt), 30 ± 5 (ΔgntP), 28 ± 8 (ΔkguT), 27 ± 6 (ΔgntP ΔkguT), 34 ± 6 (GUN). h, hours post-infection. NI (not infected), larvae injected with sterile physiological solution. Significance was estimated with log-rank test; only the results relative to PAO1 are reported (*P < 0.05; ****P < 0.0001; ns, not significant). (b) The dots represent bacterial titre 16 h post-infection in the hemolymph of larvae (n = 24 ± 4) infected with 10 µl of physiological solution containing the following number of bacterial cells: 33 ± 8 (PAO1), 37 ± 5 (ΔkguT), 34 ± 8 (ΔΔ, ΔgntP ΔkguT), 34 ± 9 (GUN). The results were plotted with OriginPro (OriginLab). The line represents the mean value. Significance was estimated with one-way Anova and Tukey post-hoc analysis (***P < 0.001). Differences among the ΔkguT, ΔgntP ΔkguT and GUN mutants were not significant at 0.05 level. (c) Phenoloxidase activity assay. Hemolymph was collected 4 h post-infection with 20000 cfu of the bacterial strains listed in the panel. The hemolymph samples deriving from groups of ten larvae infected with the same strain were pooled and phenoloxidase activity at 30 min was estimated as described in Methods. The results of four experiments done in different days (n = 12) are shown. Bars represent average with SD. Significance was estimated with one-way Anova and Tukey post-hoc analysis (****P < 0.0001; **P < 0.01; P*P < 0.05). Differences between means that share a letter (on the columns) are not statistically significant at 0.05 level.
