
Figure 2.
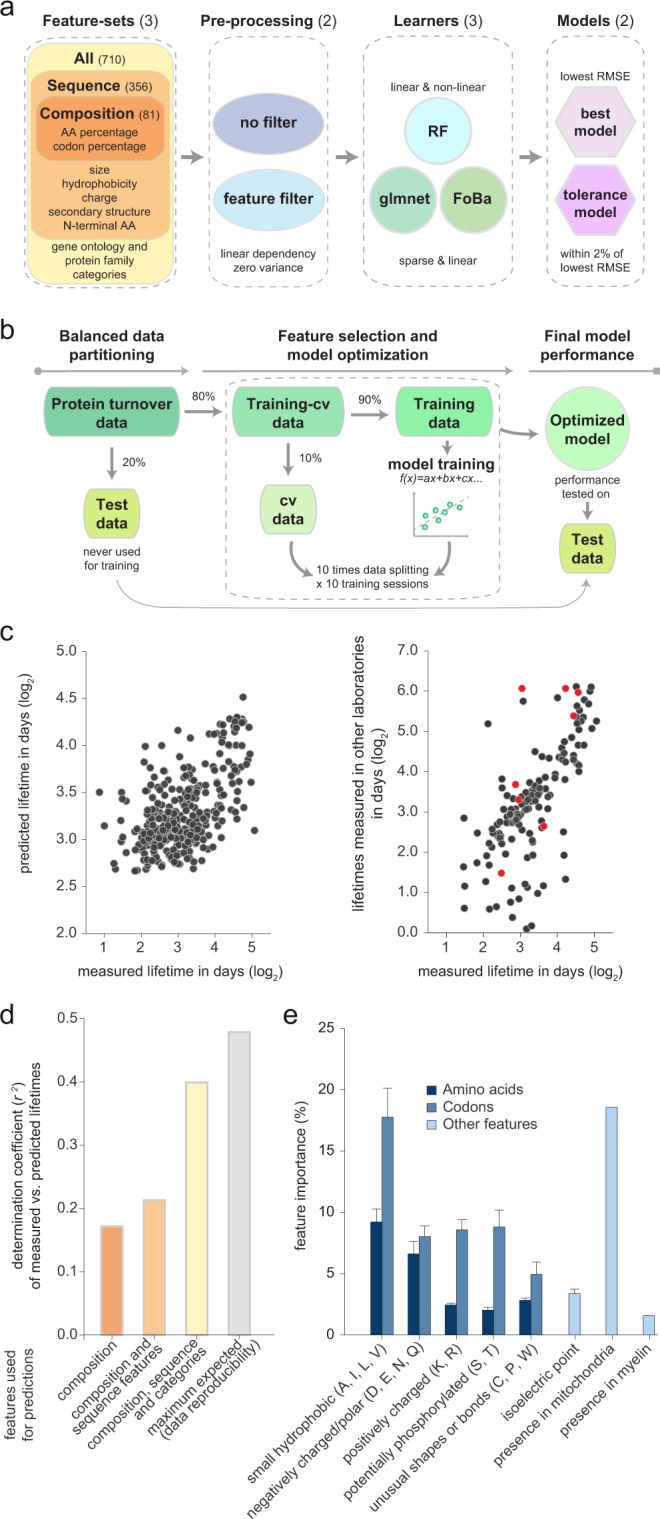
The amino acid and codon sequences can be used to reliably predict protein lifetimes. (a) Overview of the 36 models used for predicting lifetimes. Models were learned for three feature sets: (1) protein composition features (amino acid and codon percentages; 81 features); (2) composition features and 275 additional features derived from sequences (e.g. secondary structure information, length, etc.); (3) all previous features and 354 additional features. Models were tested with or without filtering features that are redundant, using three different learning algorithms (RF, glmnet and FoBa) and reporting the best (lowest RMSE) and the tolerance models. (b) Model optimization. The protein turnover dataset is split into test set (20%) and training-cross-validation set (80%). The training-cross-validation set is further split into training set (90%) and cross-validation (cv, 10%). The best cv-model, is obtained using a 10-fold cross-validation with 10 initializations. Performance of each model is evaluated on the test set comparing the RMSE of the predictions to the observed values. (c) Left: example scatter plot showing lifetimes measured in this study against respective predicted lifetimes (based on all features). Only the 20% test data relevant for measuring prediction precision are shown. Right: experimental variation between independent samples for this set of protein lifetimes, plotting our lifetimes against the respective values from two other available studies from the literature (black18; red57). (d) Pearson’s correlation coefficients between measured and predicted lifetimes by three random forests (RF) models based on sequence composition alone, on all sequence features, or on the entire feature list. For comparison, correlation coefficient between different published lifetime datasets18,57 (maximum expected). (e) Most important protein features in predicting the lifetimes, as defined by models. Amino acids were grouped in small hydrophobic (A, I, L, V), negatively charged/polar (D, E, N, Q), positively charged (K, R), potentially phosphorylated (S, T), and unusually shaped/bonded (P, W, C). Sum of the importances of these amino acids, or of their codons, was calculated and plotted. Bars: average importances of the respective features in the three RF models; error bars: s.e.m. Gene ontology features lack error bar since they are present only in the third model.