Figure 5.
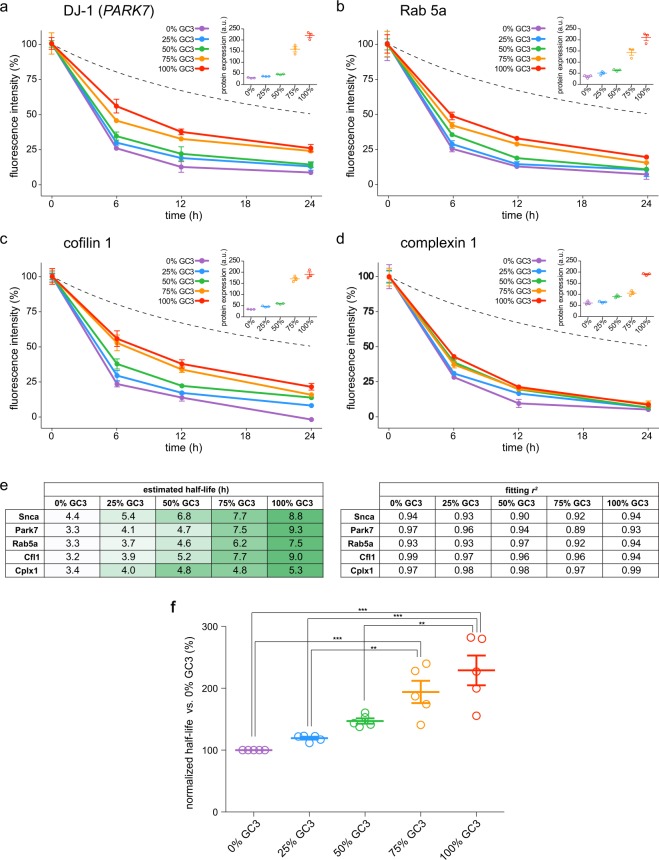
The nature of the third nucleotide influences protein lifetimes. (a–d) We designed four additional families of protein turnover sensors composed of the sequence of four different proteins fused to the SNAP-tag. For each one of the four protein species, we optimized five versions of their coding sequences with increasing percentages of G-/C-ending codons (0%, 25%, 50%, 75% and 100%), corresponding to 20 additional constructs. For each protein, the five plasmids with increasing percentages of G-/C-ending codons were separately transfected in COS7 cells in equimolar quantities. Also in this case, as for Fig. 4b, the sensors were pulsed for 2 h and chased for 24 h, revealing the turnover of the different proteins. For each desired chase time, cells were fixed, imaged with a high content microscope and the fluorescence analyzed in an automated fashion. The segmented lines represent the percentage of the dye that was lost due to the dilution caused by cell division from the beginning of the experiment. Each dot in the graphs represents the average of three separate experiments with SEM (n = 3). The inset in the upper right corner of each graph shows the relative protein expression at the beginning of the experiment (time0), measured as absolute fluorescence of every sensor. Each panel shows the results from >10.000 cells analyzed. (e) Summary of the lifetimes (expressed as t1/2), calculated through the fitting of the data represented in in Fig. 4b for Synuclein (Snca) and in panels a–d for the remaining proteins. The r2 indicates the coefficient of determination for each fitting used for the calculation of the lifetimes. (f) Lifetimes increase versus the 0% GC3 condition. Higher G-/C-ending codon percentages continuously increase the t1/2 from 0% to 100% GC3 (statistically significant trend with a linear regression P < 0.0001). With respect to the 0% GC3, in the 100% GC3 the lifetimes of these sensors are increased on average up to 229.0 ± 24%, roughly doubling their stability. ANOVA followed by Bonferroni post-hoc comparisons test: **P < 0.01, ***P < 0.001. Error bars = s.e.m.

