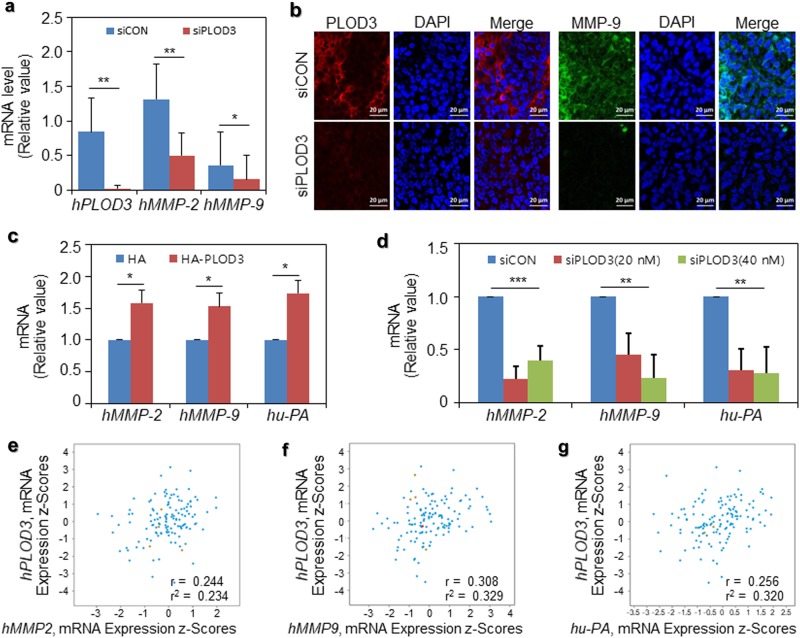
Fig. 4. MMP-2/9 and uPA expression in siPLOD3- or HA-PLOD3-treated lung cancer cells.
a hMMP-2/9 mRNA levels were determined after siPLOD3 treatment in vivo. Statistical significance was determined by Student’s t-test. *P < 0.05; **P < 0.01. b In vivo immunofluorescence of siCON- and siPLOD3-treated groups. c hMMP-2/9 and hu-PA mRNA levels after the indicated concentration of HA-PLOD3 was transfected were determined via quantitative reverse transcription polymerase chain reaction (RT-qPCR). Statistical significance was determined by Student’s t-test. *P < 0.05. d H460 cells were transfected with siCON or the indicated concentration of siPLOD3 for 24 h. hMMP-2/9 and hu-PA mRNA levels were determined via RT-qPCR. Statistical significance was determined by ANOVA analysis. **P < 0.01, ***P < 0.001. e–g Correlation of hPLOD3 with hMMP-2 or hMMP-9 or hu-PA transcripts in the cbioportal datasets of lung cancer patients

