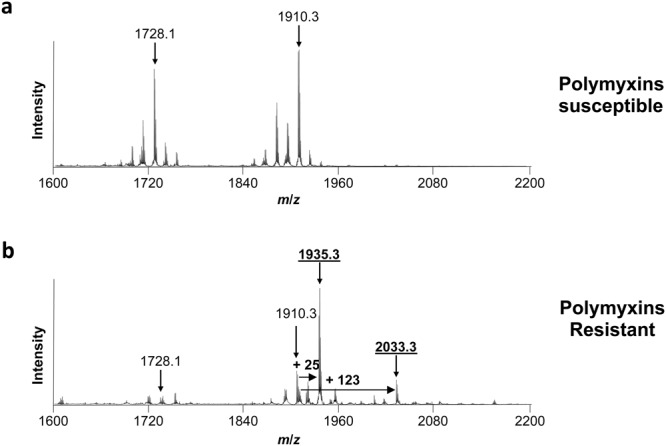
Figure 1.

Results of the MALDIxin test on A. baumannii. Representative spectra of a polymyxin-susceptible A. baumannii isolate (Ab-S1) (panel a) and a colistin-resistant A. baumannii isolate (Ab-R1) (panel b). Peaks of interest are indicated. The peaks at m/z 1728.1 m/z and 1910.3 m/z corresponds to the native lipid A of A. baumannii, the peak at m/z 1935.3 likely corresponds to the addition of pETN on the phosphate group at position 4’ of the native lipid A of A. baumannii with concomitant loss of the phosphate group on position 1, and the peak at m/z 2033.3 corresponds to the addition of one pETN on the phosphate group at position 1 of the native lipid A of A. baumannii.
