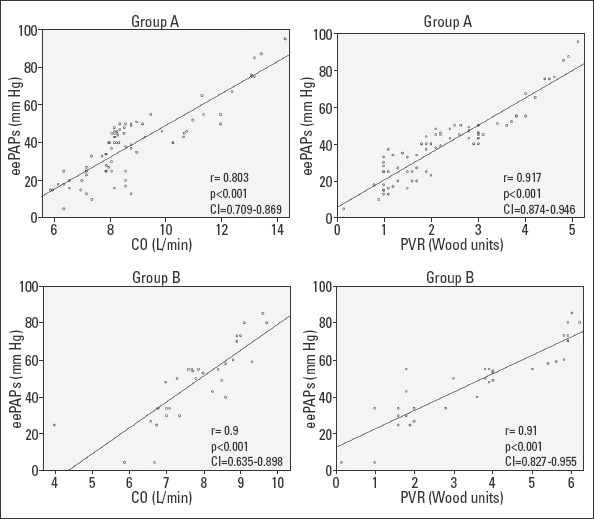
Figure 2.

Correlations between eePAP and CO and between eePAP and PVR in groups A and B
Group A - newly diagnosed overt hyperthyroidism; Group B - recurrent hyperthyroidism; Group C - subclinical hyperthyroidism; PH - pulmonary hypertension; PVR - pulmonary vascular resistance; eePAPs - echocardiographically estimated pulmonary artery pressure; CO - cardiac output; the analyse of the strength of linear relationship between levels of PAPs and CO respective PVR was performed with Spearman’s rank-order correlation
