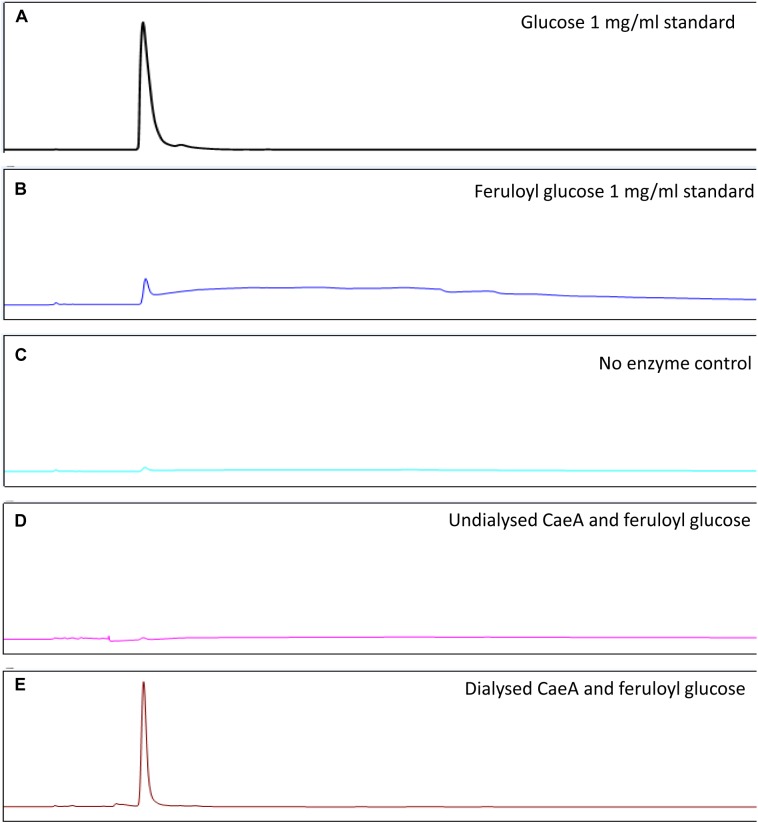
FIGURE 5.
HPAEC – PAD analysis of CaeA activity against feruloyl glucose. (A) Glucose standard (1 mg/ml). (B) Feruloyl glucose (0.5 mg/ml) standard. (C) No enzyme control where feruloyl glucose is incubated for 16 h at 37°C. (D) Undialysed CaeA incubated with feruloyl glucose after 16 h at 37°C. (E) Dialysed CaeA incubated with feruloyl glucose after 16 h at 37°C. Assays were carried out in 0.1M sodium phosphate buffer at pH 7.5 with 15 μg/ml of protein.

