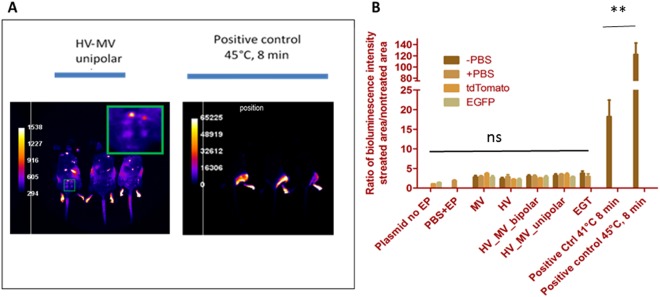
Figure 7.
Bioluminescence imaging of EP-induced expression of LucF in transgenic Hsp70 (Hspa1b) LucF mice. Luciferin (30 mg/mouse) was injected intraperitoneally 5 min before imaging (A) Images were acquired 6 h after delivery of electric pulses. (B) Quantification of LucF expression in transgenic mice after EP presented as the fold increase of the signal at the position of electrodes compared to the detected signal in non-treated skin. Groups on the left graph. −PBS: only EP, +PBS: 25 µl of PBS injected intradermally + EP, tdTomato: 25 µl (1 µg/µl) of plasmid tdTomato injected intradermally + EP, EGFP: 25 µl (1 µg/µl) of plasmid EGFP injected intradermally + EP. EP conditions (HV, MV and HV-MV) are those defined in Fig. 1. EGT 25 µl (1 µg/µl) of plasmid EGFP injected intradermally + 8 pulses of 5 ms at 240 V.Positive controls were water bath at designated temperature for 8 min.

