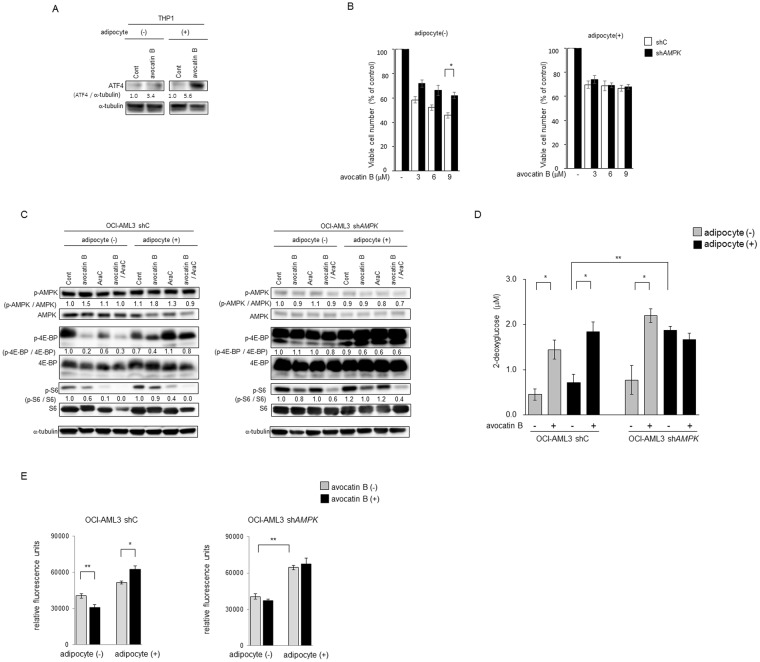
Figure 3.
Avocatin B increases ATF4 activation and AMPK-mTOR signaling in AMfL cells co-cultured with BM adipocytes. (A) THP-1 cells were co-cultured with BM adipocytes for 24 hours with or without avocatin B (10 μM), and expression levels of ATF4 protein were detected by immunoblotting; Cont, controls. Results shown are representative of three independent experiments. (B) OCI-AML3 cells transfected with control short hairpin RNA (shC) or shRNA against AMPK (shAMPK) were treated with the indicated concentrations of avocatin B for 48 hours in the presence or absence of BM adipocytes under serum-starved conditions. The effects on cell viability were determined by cell counts using the trypan blue exclusion method. Graphs show the mean ± SD of the results from three independent experiments. (C) OCI-AML3 cells transfected with control short hairpin RNA (shC) or shRNA against AMPK (shAMPK) were cultured with or without avocatin B (10 μM) and AraC (3 μM) for 18 hours in the presence or absence of BM adipocytes. Expression levels of AMPK, p-AMPK, 4E-BP1, p-4E-BP1, S6, p-S6 and α-tubulin proteins in the cells were detected by immunoblotting; Cont, controls. Results shown are representative of three independent experiments. (D) OCI-AML3 cells transfected with control short hairpin RNA (shC) or shRNA against AMPK (shAMPK) were cultured with or without avocatin B (20 μM) in the presence or absence of BM adipocytes under serum-starved conditions and glucose uptake measured. Plated cells were treated with avocatin B for 2 hours. Fluorescent signal was measured with a plate reader using the bottom read mode. Graphs show the mean ± SD of the results from three independent experiments. *p < 0.05. (E) OCI-AML3 cells transfected with control short hairpin RNA (shC) or shRNA against AMPK (shAMPK) were cultured with or without avocatin B (20 μM) for 2 hours in the presence or absence of BM adipocytes under serum-starved conditions. Cells were plated at 50,000 cells/well, after which fatty acid (FA) uptake was determined by adding a fatty acid mixture (dodecanoic acid fluorescent fatty acid substrate) and incubating for 1 hour. Fluorescent signal was measured with a plate reader using the bottom read mode. Graphs show the mean ± SD of the results from three independent experiments. **p < 0.01; *p < 0.05.

