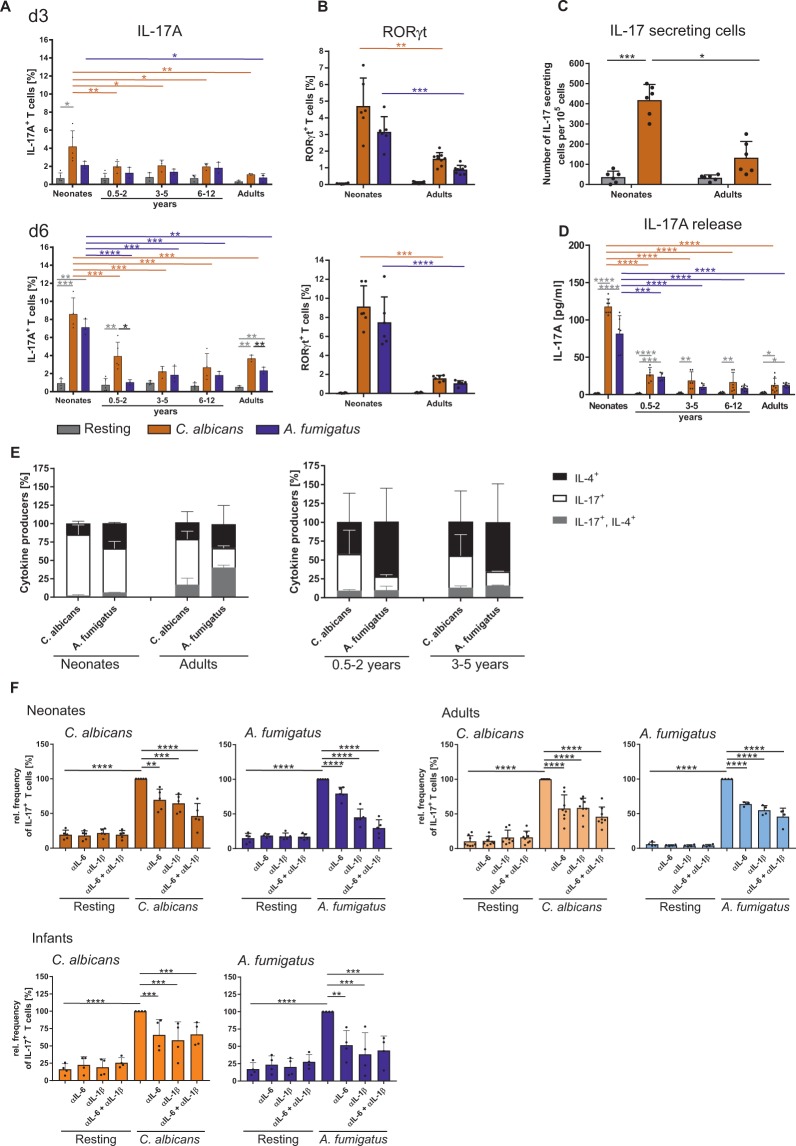
Figure 6.
Fungi specific T cells produce IL-17 in an age dependent manner. CD4+CD45RA+CD31+ T cells from neonates, infants, children, and adults were co-cultured with monocytes pulsed with C. albicans- or A. fumigatus-lysates. (A,B) The frequency of T cells expressing signature Th17 molecules IL-17 (A) and RORγt (B) were analysed by flow cytometry at day 3 (upper Panel) and day 6 after stimulation (lower panel) (C) Bar graph representing the ELISPOT analysis of the quantitative IL-17, produced by the T cells from neonates and adults which were either stimulated or not for 3 days as described in (A). (D) Determination of IL-17A cytokine release of CD4+CD45RA+ T cells of neonates, infants and children or adults by LegendPlex which were either stimulated or not for 3 days as described in (A). (E) Frequency of T cells expressing intracellular IL-17 (white), IL-4 (black) and both IL-17/IL-4 (grey) were measured by flow cytometry after 6 days of stimulation, analysed by boolean gating and shown as different fractions of cytokine expressing cells in a stacked bar chart. (F) Bar graph showing IL-17 expression by CD4+CD45RA+CD31+ T cells of neonates, adults, and infants of 0.5-2 years old, stimulated for 6 days as described in (A) in the presence or absence of neutralizing antibodies for IL-1ß, IL-6 or both. Cumulative results are shown and each dot in (A–D) and (F) represent a different donor. The error bars in figures denote ± SD. *p < 0.05, **p < 0.01, ***p < 0.001, ****p < 0.0001, as determined by one-way Anova with Tukey post hoc test (A-C, F) or Kruskal Wallis with Dunn’s post hoc test (D).

