Figure 2.
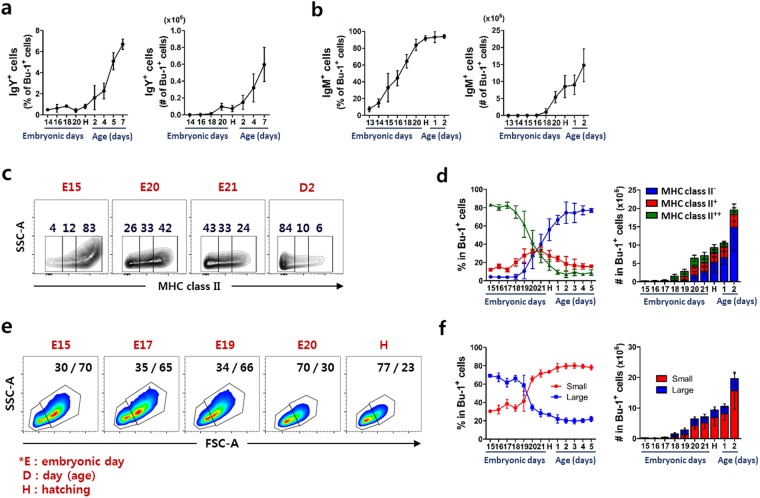
The phenotype of bursal B cells rapidly changes at around hatching. Single cells produced from the bursa were stained with anti-Bu-1 antibody together with anti-IgY, -IgM or -MHC class II antibody. The percentage and absolute number of (a) IgY+ and (b) IgM+ bursal B cells before and after hatching was examined using flow cytometry. (c,d) Surface expression of MHC class II on bursal B cells was classified as a negative (−), low (+) and high (++). (c) Expression of MHC class II in bursal B cells at indicated stage. The number in each area indicates the percentage of cells. (d) The percentage and absolute number of MHC class II expression in bursal B cells during the embryonic and post-hatching stages. (e,f) B cells were distinguished by cell size as small (low forward-scatter) or large (high forward-scatter) using flow cytometry. (e) Differential display of small or large bursal B cells at indicated stage. Numbers in each area show the percentage of small or large cells. (f) The percentage and absolute number of small or large bursal B cells during the embryonic and post-hatching stages. Each data point represents the mean of four to ten chickens with SD.

