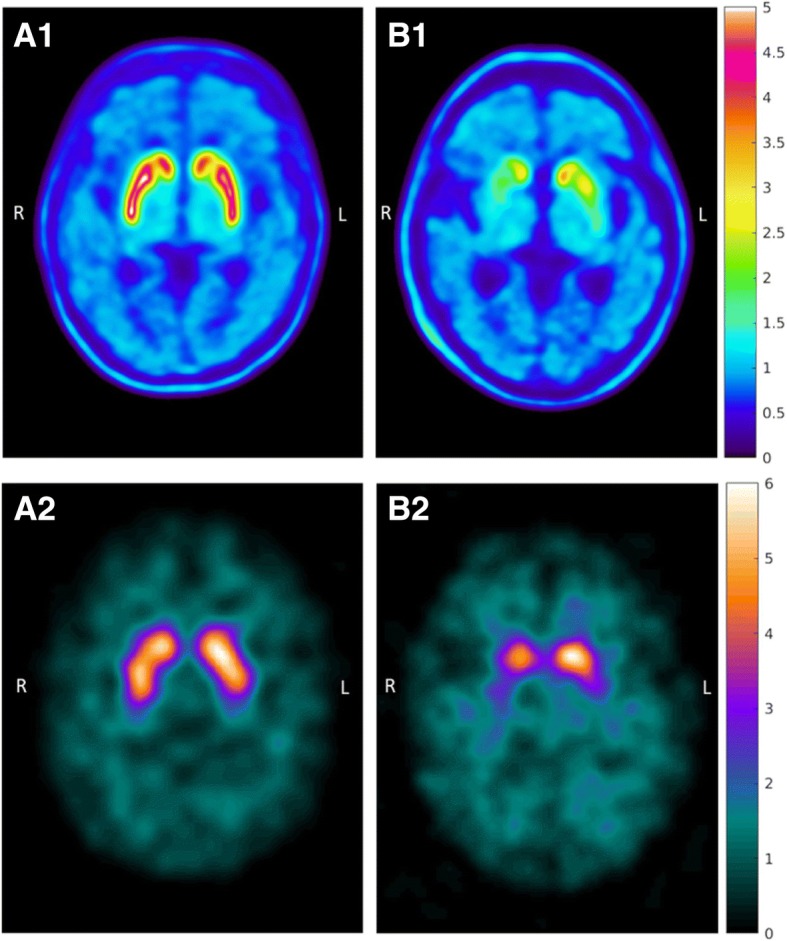
Fig. 1.

Examples of [18F]FE-PE2I PET and [123I]FP-CIT SPECT images in the same individuals. Representative images of FE-PE2I PET (parametric DVR images) and FP-CIT SPECT (SUR images) of the same two subjects. Healthy control examined A1 with FE-PE2I and A2 with FP-CIT. Patient with parkinsonian syndrome since 6 months examined B1 with FE-PE2I PET and B2 with FP-CIT SPECT. PET image scale: DVR (= BPND + 1). SPECT image scale: activity uptake in striatum divided by cerebellum activity
