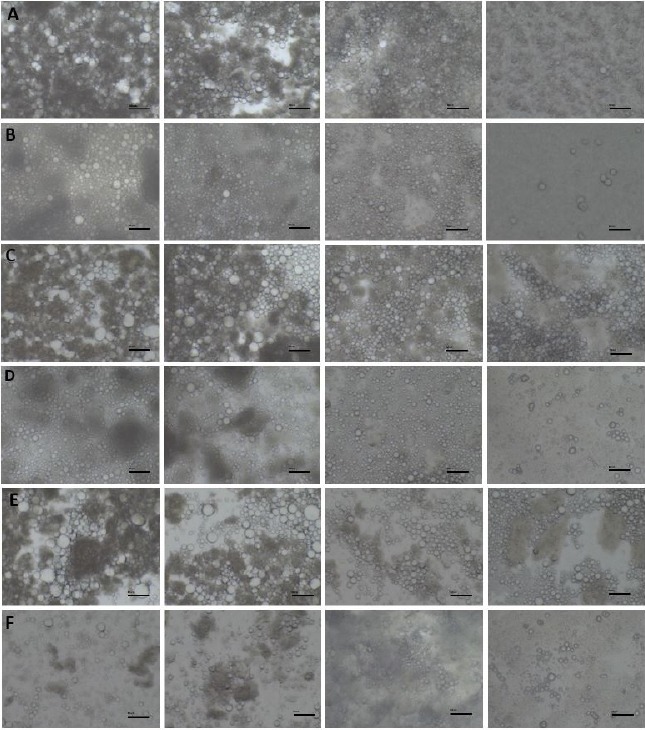
Fig. 3. Microscopic images of white cheese emulsions produced with different emulsifying salt.

Images were represented 0%, 1%, 2%, 3% emulsifying salt from left to right. (A) FF with 25% dry matter, (B) RF with 25% dry matter, (C) FF with 20% dry matter, (D) RF with 20% dry matter, (E) FF with 15% dry matter, (F) RF with 15% dry matter. RF, reduced-fat; FF, full-fat.
