
Fig. 3. Genome map of L. plantarum JDFM LP11.
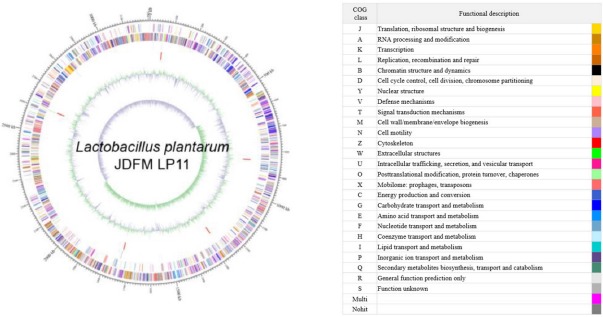
Marked characteristics are shown from outside to the center; CDS on forward strand, CDS on reverse strand, tRNA, rRNA, GC content and GC skew. Predicted genes are color-coded by functional category. The scale is kilobase (kb) pair. CDS, coding DNA sequences; GC, guanine or cytosine.