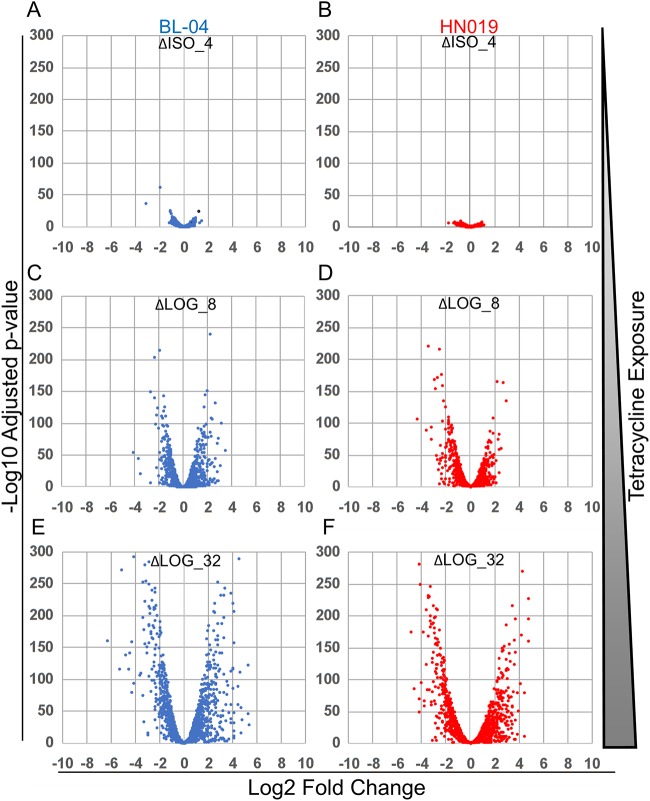
FIG 5.
Volcano plots of expression differences between Bl-04 and HN019 during different tetracycline exposures. Experimental names compared to the control ISO_0 experiment with no tetracycline are shown at the top of each plot and are as follows: (A) Bl-04 ΔISO_4, (B) HN019 ΔISO_4, (C) Bl-04 ΔLOG_8, (D) HN019 ΔLOG_8, (E) Bl-04 ΔLOG_32, and (F) HN019 ΔLOG_32. Negative log change represents higher expression in the control (ISO_0), and positive log change indicates higher expression in the respective treatments. Results are shown for Bl-04 (blue) and HN019 (red).

