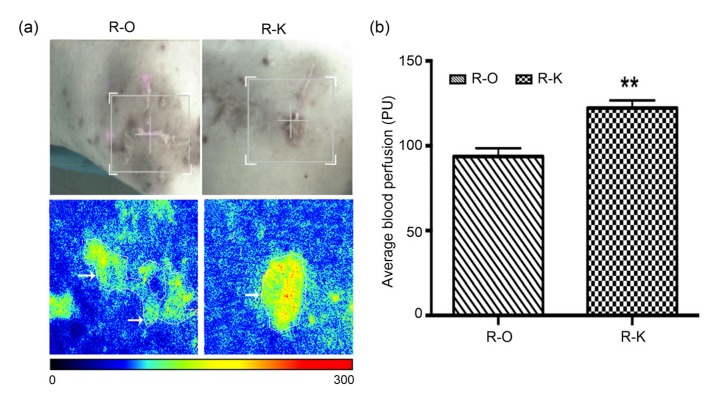
Fig. 4.
Average blood perfusion of the keloid tissue in recurrent patients
(a) The blood perfusion detecting image; (b) Average blood perfusion of the R-O and R-K groups (R-O: recurrent patients from the O group; R-K: recurrent patients from the K group). The white arrows indicate keloid blood perfusion. Red represents high blood perfusion. Data are expressed as mean±SD (R-O group, n=8; R-K group, n=15). ** P<0.01, vs. the R-O group (Note: for interpretation of the references to color in this figure legend, the reader is referred to the web version of this article)

