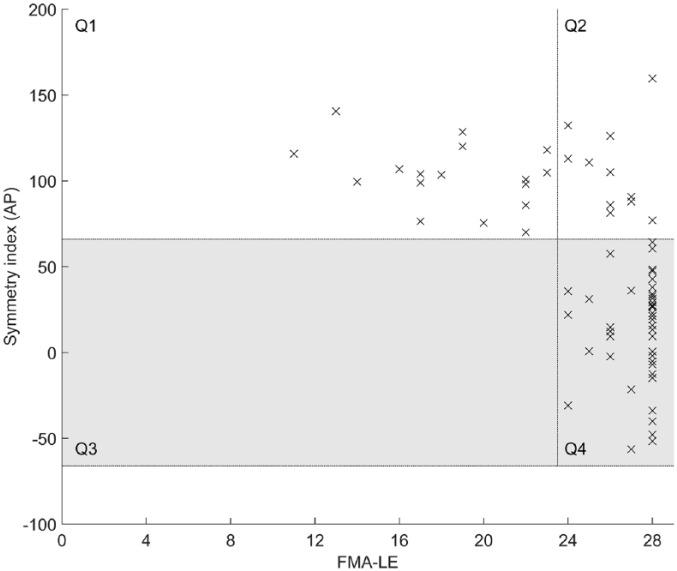
Figure 2.
Dynamic control asymmetry (expressed as a symmetry index) plotted against leg motor impairment (expressed as Fugl-Meyer Assessment—lower extremity [FMA-LE] score). The gray area represents the normal range of symmetry indices obtained from healthy individuals.22,25 Q1 and Q2 represent participants with SI values >66% (ie, in favor of the less-affected leg) and FMA-LE scores <24 points (Q1) or ⩾24 points (Q2). None of our participants with a FMA-LE score <24 points had a SI value within the normal range for healthy individuals (gray area; Q3). Participants in Q4 had a SI value within the normal range and a FMA-LE score ⩾24 points. The vertical line represents the distinction between a FMA-LE score <24 (ie, moderate to severe leg motor impairment) and a FMA-LE score ⩾24 points (ie, mild leg motor impairment).
Abbreviation: AP, anteroposterior direction.

