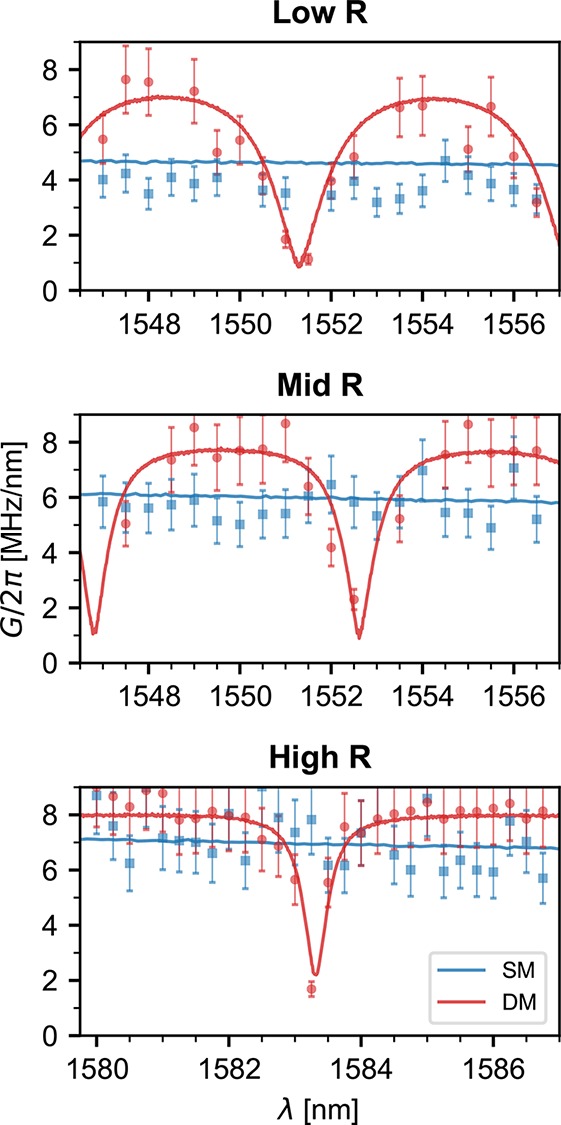
Figure 4.

Center-of-mass optomechanical
coupling G/2π as a function of wavelength λ
obtained through the derivative of the cavity dispersion max{|∂ωc/∂x|} (points) and
through the membrane-in-the-middle model  (lines). The
blue data are taken from single- (SM) and the red from double-membrane
(DM) devices. The corresponding PhC patterns are indicated on top
of each figure with the wavelength range studied here marked in gray
in Figure 2.
